The modern Australian family
You are in an archived section of the AIFS website
Overview
This facts sheet explores major trends in Australian family life, including information about children’s experience of family, the transition to adulthood, marriage, grandparenting, family support and migrant families. Collecting data from several studies, it is a fascinating picture of key stages in the lives of Australian families.
Key messages
-
In 2011, 71% of children under 15 years old lived with two biological or adoptive parents. While 82% of children are born into two-parent families, as they grow, progressively fewer live with both biological parents (only 53% by age 17 years).
-
Children in step-families experience complex living arrangements, sharing time between parents. Each year, one in five children aged 4–17 years were in shared time arrangements five years after parental separation .
-
In 2011, very few 15–24 year olds were married (1% of males and 4% of females), but a larger number were cohabiting (6% of males and 13% of females). By contrast, around 60% of 25–34 year olds were cohabiting. Around 1% of co-resident couples were same-sex couples.
-
Grandparents commonly care for grandchildren, with 65% of grandparents aged 40–69 years doing caring duties at least once a week.
-
In testing times, 84% of Australian born people said they would turn to family for help. In contrast, only 58% of newly arrived migrants, who have fewer family members nearby, said they could turn to family when in need.
-
In 2013–14, more than 20% of people said either themselves, a friend or family member had been affected by mental illness, alcohol or drugs, or abuse or violence in the past year.
Introduction
Each of us sees family from a different perspective as we grow and move through life.
This special Australian Institute of Families (AIFS) Facts Sheet explores the different phases of family, from the families we live with as children to the families we form as we grow older.
Of course family life, and life more generally, is more complex and challenging for some people in our community. In this Facts Sheet we also present statistics relating to particular stressors facing some Australians, including recent arrivals to Australia.
Children's experiences of family
It is perhaps stating the obvious that family is central to the lives of children.
Living at home
On the night of the 2011 Australian census,1 of children aged under 15 years old:
- 71% lived with two biological or adoptive parents;
- 19% lived with a single mother;
- 2% lived with a single father;
- 4% lived with a step-father and a biological/adoptive mother;
- 1% lived with a step-mother and a biological/adoptive father; and
- 2% had other circumstances, including being a foster child or living with another relative.
Most children are born into two-parent families, but - as Figure 1 shows - as they grow their circumstances often change. Progressively fewer live with both biological parents.
Figure 1: Children's family composition by child age
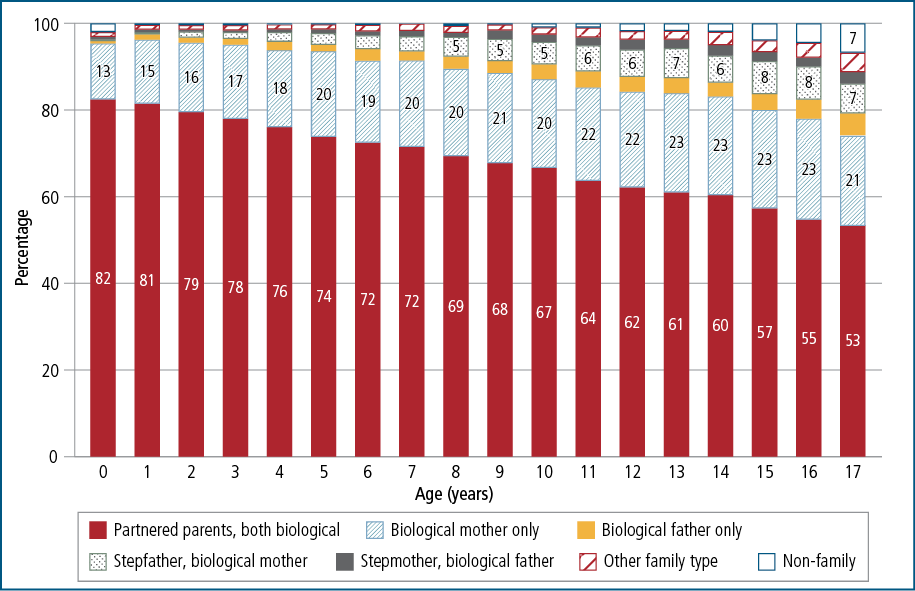
Source: Australia Census 2011 Unit record files
Growing up in Australia: the Longitudinal Study of Australian Children is contributing a wealth of information about children's lives in Australia today. The research from this study provides insights on children's circumstances and outcomes across family units, and explores how children's family life changes as they grow.2
An important point for children living with a single parent or in a step-family, is that their family life is likely to be relatively complex - especially if they spend time living with or seeing their other parent. According to the Longitudinal Study of Separated Families (2008-2012), 20% of children aged 4-17 years were in shared time arrangements (i.e., spending 35-65% of nights annually with each parent) five years after parental separation, 7% were living mainly with their father, although the majority of children were mainly living with their mother.3
The Australian Bureau of Statistics (ABS) 2012-13 Family Characteristics & Transitions Survey4 found that of children with a natural parent living elsewhere:
- 31% had face-to-face contact with that parent at least once a week;
- 25% saw that parent at least fortnightly or monthly (but not weekly);
- 16% saw that parent at least once a year (but not monthly); and
- 28% saw that parent less than once a year or never.
These patterns of contact varied across ages of children (see Figure 2).
Figure 2: Children's face-to-face contact with a natural parent living elsewhere, 2012-13

Source: ABS 2012-13 Family Characteristics & Transitions Survey
Figure 3: Changing living arrangements through young adulthood
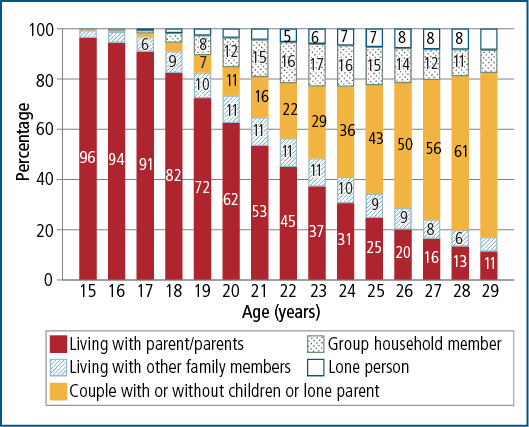
Source: Australian 2011 Census, Tablebuilder
Moving out
A significant event in young peoples' lives is their moving out of the family home. As Figure 3 shows, the percentage of young people living "at home" declines sharply after children reach 17 years of age, such that 47% of 21 year olds are no longer living with their parents or parent, while only 11% of 29 year olds still live in the family home.
However while children increasingly live away from their parents and siblings as they grow, this does not mean the end of these relationships.
1 ABS (Australian Bureau of Statistics). (2011). Australian Census confidentialised unit record file.
2 See, for example, the Growing Up in Australia Annual Statistical Report 2014, which includes research on children's views about parental separation, parents' gender role attitudes, children's early home learning environments, transitions to secondary school, educational expectations and early onset of crime and delinquency. Available at <www.growingupinaustralia.gov.au/pubs/asr/2014/index.html>
3 Qu, L., Weston, R., Moloney, L., Kaspiew, R., & Dunstan, J. (2014). Post-separation parenting, property and relationship dynamics after five years. Melbourne: Australian Institute of Family Studies.
4 ABS. (2015). Children aged 0-17 years with a natural parent living elsewhere, contact arrangements by age of child-2012-13, 2009-10, 2006-07. Retrieved from <www.abs.gov.au/AUSSTATS/[email protected]/DetailsPage/4442.02012-13?OpenDocument>. Excludes families with unknown contact frequency.
The childhood family into adulthood
Despite the changes that many of us go through in our own relationships as our lives evolve, the relationships with our own parents and siblings can remain a dependable source of love and support, just as parents themselves continue to value their relationships with their children after they have left the parental home.
In 2008, the Household, Income and Labour Dynamics in Australia (HILDA) study collected information about contact with siblings and parents.5
As shown in Figure 4:
- Across all ages, those who have living parents very often have at least monthly contact with them, in person or by other means such as phone or email.
- Regular face-to-face contact decreases over time, which probably reflects that parents and children do not live sufficiently close for regular visits.6
In addition to parents, over 90% of people have a living sibling, as shown in Figure 5. Sibling bonds tend to be strong. Even at ages 75 years and over, 43% of people are still in at least monthly contact with a sibling, including 20% who see their sibling at least once a month.
Figure 4: Our parents in our lives as we grow
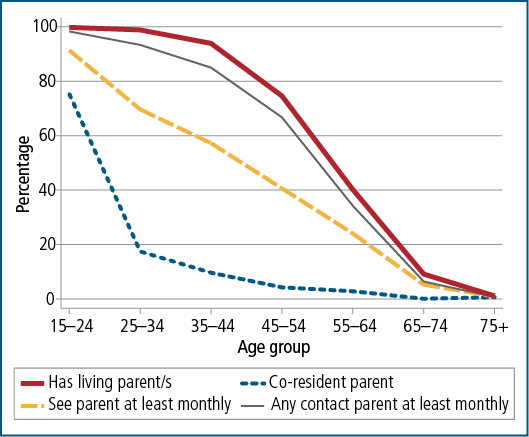
Source: HILDA Wave 8, 2008
Figure 5: Our siblings in our lives as we grow
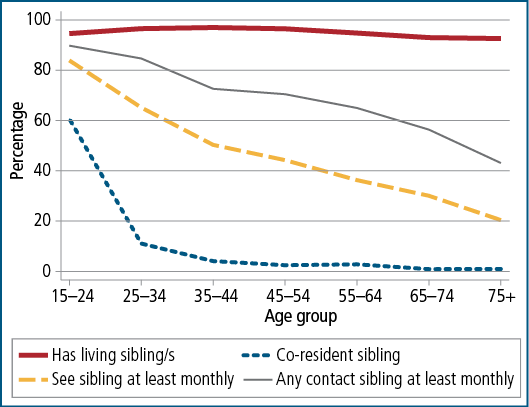
Source: HILDA Wave 8, 2008
5 The HILDA Project was initiated and is funded by the Australian Government Department of Social Services (DSS) and is managed by the Melbourne Institute of Applied Economic and Social Research (Melbourne Institute). The findings and views reported in this Facts Sheet, however, are those of the author and should not be attributed to either DSS or the Melbourne Institute. Different waves of the HILDA survey have been used in this sheet, to make use of questions asked only at particular waves. HILDA does not include people living in non-private dwellings.
6 See "Proximity to and contact with non-resident siblings and parents" in Wilkins, Warren, Hahn & Houng (2011). Families, Incomes and Jobs, Volume 6. A Statistical Report on Waves 1 to 8 of the Household, Income and Labour Dynamics in Australia Survey.
Love and marriage
For many, forming a cohabiting or marital relationship is the first pathway into making a family of one's own. Many possible transitions then follow, with relationships often formalised through marriage or registration of a civil union - some of which will later break down.
We can see these different family forms by looking at the relationship status of men and women, by age, in Figure 6.
HILDA data from 2011 shows that, while very few 15-24 year olds are married (1% of males and 4% of females), a significant number are cohabiting (6% of males and 13% of females). It shows that at 25-34 years of age, a small percentage are divorced or separated, and about 60% are living with a partner.
According to the 2011 Census, while most people reporting having a co-resident partner are in a heterosexual relationship, about 1% of couples are same-sex.7
While cohabitation is widely accepted as a family form, marriage is still highly valued by many. In HILDA in 2011 people aged 15 years and over were asked to indicate how they felt about marriage. Here are some of their answers:8
- "Marriage is an outdated institution": 58% disagreed, 32% were in the middle and 9% agreed.
- "Marriage is a lifetime relationship and should never be ended": 26% disagreed, 39% were in the middle and 35% agreed.
- "It is alright for an unmarried couple to live together even if they have no intention of marrying": 14% disagreed, 24% were in the middle and 62% agreed.
Interestingly, as Figure 7 shows, attitudes vary with current relationship status.
Parenthood is a major driver of new family forms. As children grow and leave home, parents enter a new phase of family life. At each phase there are new and varied challenges.
For older men and women, a significant change is brought about by the death of a spouse or partner, with women more likely than men to be widowed, especially at ages 75 years and over. Some family transitions are ones that enhance our lives, while others take all the support our family can give us to get us through.9
7 ABS. (2013). 4102.0 - Australian Social Trends, July 2013. Retrieved from: <www.abs.gov.au/AUSSTATS/[email protected]/Lookup/4102.0Main+Features10July+2013
8 Respondents' level of agreement was captured on a scale of 1 to 7, one being strongly disagree and 7 being strongly agree. We report scores of 1 or 2 as "disagree", 3 to 5 as "middle" and 6 or 7 as "agree".
9 For an AIFS report on how life satisfaction changes when different life events are experienced, see Life Satisfaction Across Life Course Transitions <aifs.gov.au/publications/life-satisfaction-across-life-course-transitions>.
Grandparenting
Many parents confront issues related to their participation in employment, and face decisions about caring for children and providing care to others. Below, we focus on one aspect of care that is especially valued by parents: care provided by grandparents. This care not only helps parents manage their work responsibilities, but provides opportunities for development of relationships across generations.
We know that grandparents are often called upon to care for their grandchildren, sometimes instead of, and sometimes as a supplement to, other care arrangements.10
According to HILDA in 2011:
- 65% of grandparents aged 40-69 years sometimes cared for grandchildren (with 28% at least once a week);
- 27% of grandparents aged 70 years and over sometimes cared for grandchildren (with 10% at least once a week).
Some gendered patterns in grandparent care are apparent, with 54% of grandmothers providing care to grandchildren (25% at least weekly), compared to 46% of grandfathers (18% at least weekly). Of course grandparent care may be provided by a couple. Of the grandfathers providing weekly grandparent care, 90% had a spouse; of grandmothers providing weekly grandparent care, 72% had a spouse.
Figure 6: Relationship/marital status of men and women across all ages
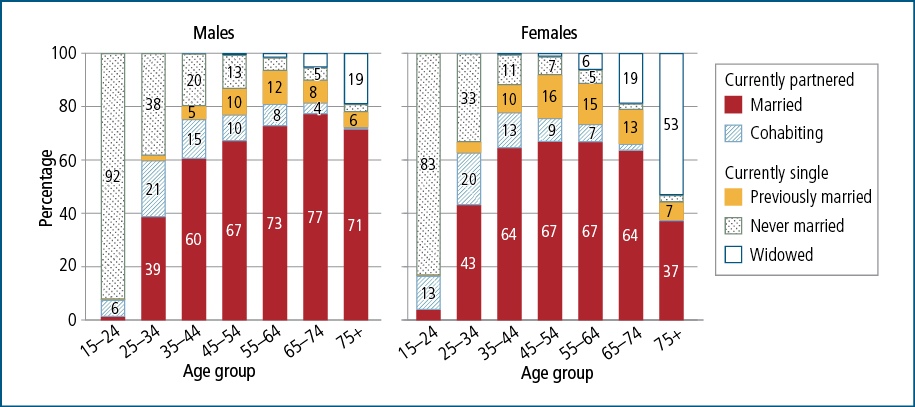
Source: HILDA, Wave 11
Figure 7: Attitudes vary with relationship status
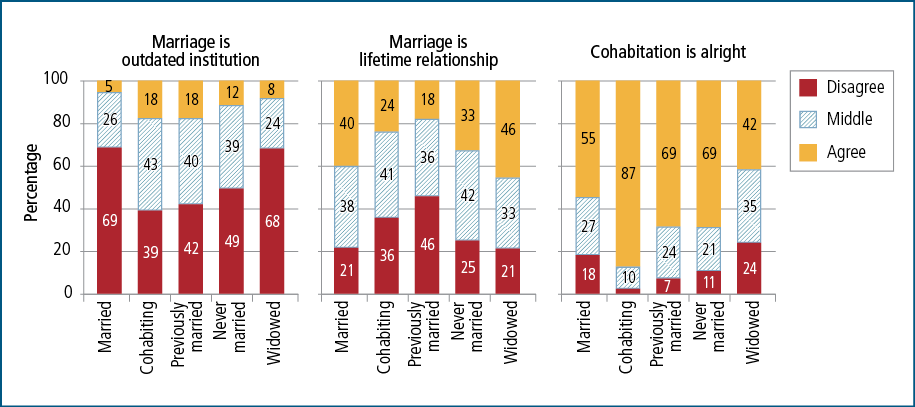
Source HILDA, Wave 11
10 See, e.g., the Families Week Facts Sheet 2015. <aifs.gov.au/research/research-reports/child-care-and-early-childhood-education-australia>
Who do we turn to for help?
At different times in our lives we all need the help of others, whether for practical, emotional or financial reasons.
In the ABS 2013-14 General Social Survey, most people (95%) aged 15 years and over said they had someone who does not live with them to turn to in the time of a crisis. When asked who they would turn to (they could nominate more than one of the following):11
- 80% said they would turn to a family member;
- 66% said they would turn to a friend;
- 22% would turn to a work colleague;
- 18% would turn to a neighbour; and
- 21% would turn to a service or professional.
Figure 8 shows that with age, people are more likely to say they would turn to the help of a neighbour than a friend or work colleague. A minority at all ages say they have no-one to call upon in a time of crisis.
Figure 8: Who do we go to for help?
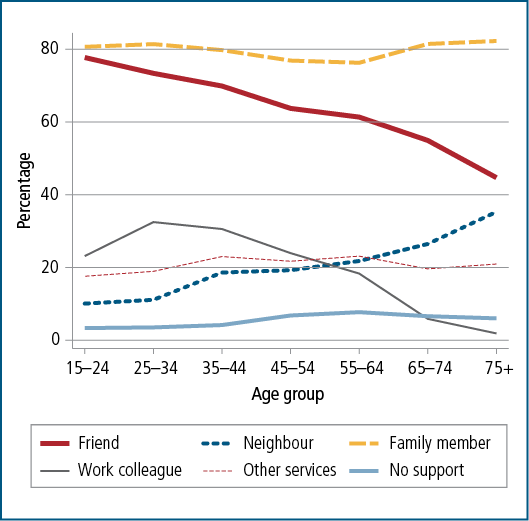
Source: ABS 2013-14 General Social Survey
Newly arrived migrants often have fewer people they can turn to.
Among Australian-born persons, 84% cited their family as a source of support; whereas for those born overseas - particularly more recent arrivals - the picture was different. Of those arriving since 2006, only 58% said they would turn to a family member; rising to 82% for those arriving before 1986.
11 ABS. (2014). 2013-14 General Social Survey. Derived from the confidentialised unit record file of this survey (Remote Access Data Laboratory).
Newly arrived migrants
Some migrants to Australia arrive here as a family. Some have children, some do not. Some arrive to join family already here and others arrive as single adults. The family circumstances of newly arrived migrants are therefore very diverse, and this of course continues to change after their settlement.
AIFS examined ABS data12 as to whether migrants who have arrived permanently in Australia since 2003 (referred to in this Facts Sheet as newly arrived migrants) are living with family members or with others. We looked at visa class, since the circumstances of migrants arriving on different types of visas are likely to be very different. We also looked at year of arrival, to see how time in Australia makes a difference to migrants' living arrangements.
As Figure 9 shows, in 2011:
- A minority of recently arrived migrants were not living in a family household. This was most likely for the most recently arrived humanitarian migrants (12%).
- Another minority were living in a family household, but not as a parent or child. Most commonly the relative was a brother or sister. Again, this was most likely for the most recently arrived humanitarian migrants (10%).
- The majority of recently arrived migrants were living with a partner or were children in a family household.
The family circumstances of humanitarian migrants is also being explored within the Building a New Life in Australia study, which is following the settlement journey of a sample of humanitarian migrants who arrived in Australia or were holding a permanent visa in 2013. Wave 1 was conducted in 2014.13
Figure 9: Relationship in the household at 2011 of newly arrived migrants, by year of arrival and visa class
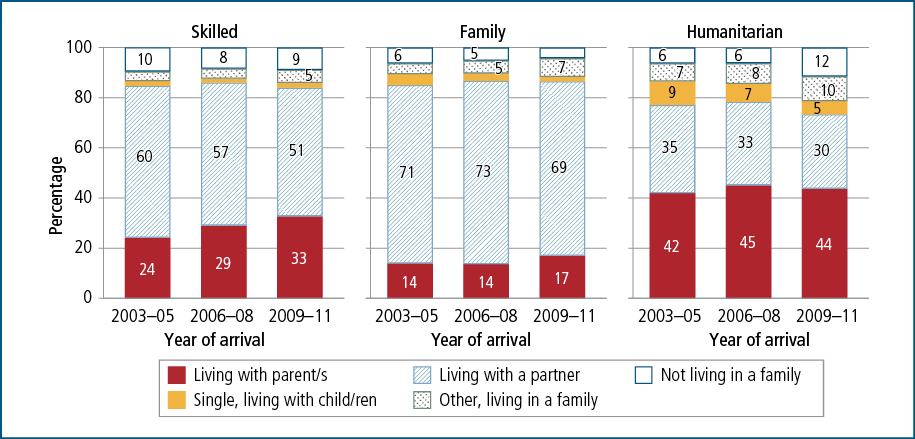
Source: Australian Census and Migrants Integrated Dataset, 2011
Looking just at the main applicants on the visa application within this study:
- 52% arrived with other family members (48% did not).
- 49% had family in Australia prior to their arrival (51% did not).
- 11% had family migrate to Australia between their arrival and the time they were first interviewed for the study (89% had not).
- 27% had limited family connections in Australia, having no family in Australia before or since arrival, and having arrived without family.
Also, 54% had family still overseas waiting to migrate to Australia.
These data clearly show why newly arrived migrants often are unable to draw upon family when they are faced with challenging times.
12 ABS. (2011). Australian Census and Migrants Integrated Dataset, 2011 (Catalogue No. 3417.0.55.001). Accessed through Tablebuilder. Dataset includes 2011 Census data matched to Immigration records for people who migrated to Australia under a permanent Skilled, Family or Humanitarian stream visa and arrived in Australia between 1 January 2000 and 9 August 2011. (Note: year of arrival on the immigration records refers to most recent arrival, while year of arrival as captured in the census and used in the data shown, may refer to an earlier year of arrival.)
13 In 2012, the former Department of Immigration and Citizenship (DIAC), now the Department of Immigration and Border Protection (DIBP), commissioned the BNLA project. As part of the 2013 Machinery of Government changes, responsibility for the project moved from DIAC to the Department of Social Services at the end of Wave 1 fieldwork in April 2014.
To be eligible for the study, BNLA participants had to have arrived in Australia or been granted a permanent visa three to six months prior to their Wave 1 interview (between May and December 2013). For more information about the sampling methodology, see Family Matters 94 article <aifs.gov.au/research/family-matters/no-94/building-new-life-australia>. Weighted data were used in statistics presented here.
Families facing challenges
Everyone deals with challenges from time to time - either directly or through being close to someone else who is facing a problem.
The ABS 2013-14 General Social Survey asked people whether certain stressors had been a problem for them or for family or close friends in the previous 12 months. When asked if they had been affected by their own, a friend's or one of their family member's problems:
- 13% reported they had been affected by mental illness;
- 7% reported they had been affected by alcohol or drug-related problems; and
- 3% reported they had been affected by an experience of abuse or violent crime.
AIFS' Australian Gambling Research Centre (AGRC) has been researching people affected by problem gambling:
- 4.3% of the population experience moderate (3.7%) to severe (0.6%) gambling problems according to self reports in a national gambling survey;14 and
- around 7% of the population is affected by people with severe gambling problems.15
While an individual family member's problems can place stress on a family, we should not lose sight of the fact - as reported above - that the help and support of one's family is the first thing that most of us seek when we face life's challenges. In challenging times, family is more important than ever.
Media releases
17 May 2016