Work and family responsibilities through life
You are in an archived section of the AIFS website
Overview
Most Australians at some point face the challenges of balancing work and family responsibilities. The pressures that families face when negotiating these issues has long been a policy concern. Discussions of work and family balance are prominent in the media and indeed everyday conversations.
To support the 2008 National Families Week, the Australian Institute of Family Studies has prepared this Facts Sheet about work and family balance. The theme for Families Week in 2008 is "Work and family: Getting the balance right", which reflects the importance of encouraging Australians, particularly working parents, to find ways to more effectively achieve work and family balance.
Engagement in paid employment varies as we move through the various stages of life: finishing education, relationship formation, having children, caring for a sick or elderly family member, the arrival of grandchildren and retirement, for example. These life transition points are also often associated with changes in caring responsibilities.
Paid employment through life
Figure 1 shows the employment rates of men and women by age for 1996 and 2006. As young men and women leave school and complete tertiary education, employment rates increase rapidly. In 2006, the employment rate:
- of women aged 15-19 years was 49% and for those aged 20-24 years was 73%; and
- of men aged 15-19 years was 45% and for those aged 20-24 years was 79%.
After age 20-24 years, the employment rates of men and women diverge quite sharply, reflecting the effects of childbearing and childrearing on women's labour force participation:
- For men, employment rates reach a peak of 90% at age 30-34 years. The employment rate then remains stable until age 45-49 years, beyond which it begins to decline.
- For women, the employment rate for those aged 25-29 years is similar to that for women aged 20-24 years. It then drops to 69% for the age groups 30-34 years and 35-39 years. Beyond age 40, employment rates of women increase to reach a peak of 77% for women aged 45-49 years. As is the case for men, women's employment participation declines from this age.
Over the decade 1996-2006, the employment rate of women in all age groups increased. The largest increases were for women aged 50-64 years: for women aged 50-54 years, the employment rate increased from 60% in 1996 to 73% in 2006; for those aged 55-59, it increased from 40% to 57%; and for those aged 60-64, it increased from 17% to 34%.
Between 1996 and 2006, there were also increases in employment rates for men in all age groups. While the changes were more modest than for females, the largest increases were for older males, with the employment rate of men aged 55-59 years increasing from 66% to 74% and of men aged 60-64 years, from 42% to 55%.
Figure 1: Employment rates, males and females by age, 1996 and 2006
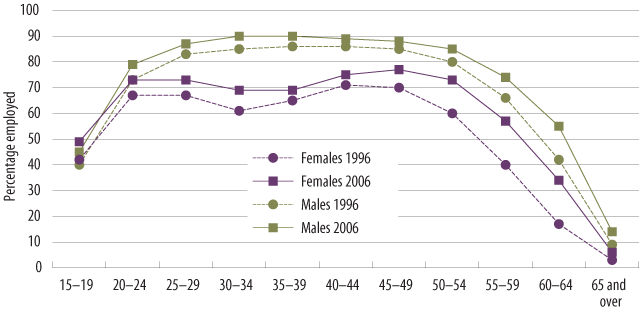
Note: People who did not state their labour forces status on the Census form have been excluded from the calculations.
Source: Census of Population and Housing, Australia, online tables.1
Hours worked
Australia has long full-time working hours by international standards. In 2006 in Australia, full-time employed men worked an average of 45.9 hours per week, compared to many OECD countries with averages of less than 43 hours per week (for example, Denmark, France, Germany, Ireland, the Netherlands, Sweden).
At the same time, Australia has high rates of part-time employment, particularly for women. In 2006, 41% of employed women worked part-time, compared to an OECD average of 26%. Just 16% of employed Australian men worked part-time, compared to an OECD average of 8%.2
The mix between part-time and full-time employment varies through life. Figure 2 shows the proportion of employment that is part-time and the proportion that is full-time for men and women, according to age.3 Among employed women:
- the proportion of employment that is full-time is highest for the age group 25-29 years (67%);
- at younger ages (15-24 years) there is a high rate of part-time work, reflecting the high rates of participation in education;
- reflecting childbearing and childrearing, the proportion of employment that is part-time is high among women aged 30-44 years (40% for 30-34 years, 49% for 35-39 years, and 48% for 40-44 years); and
- there is then a slight increase in the proportion working full-time among employed women aged 45-54 and 50-54 years, before part-time work again predominates in the older age groups.
Figure 2: Full-time and part-time work, males and females by age, 2006
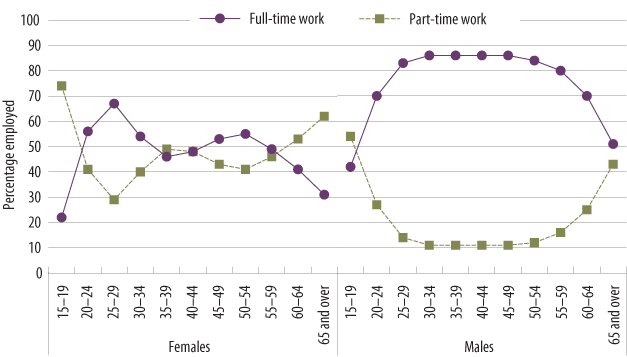
Note: People who did not state their labour forces status or hours on the Census form have been excluded from the calculations. People were classified as working part-time (less than 35 hours per week), full-time (35 hours or more), or away from work. The latter category has not been shown in this figure.
Source: Census of Population and Housing, Australia, online tables.4
For employed men at either end of their working life (15-19 years and 65 years and older), about half are employed part-time and half full-time. For other age groups, employment is mostly full-time. The proportion of full-time employment for men is higher than for women for all age groups.
Women's part-time employment is a key strategy used by Australian families to balance work and family responsibilities. Many of the women who are employed part-time are working quite short hours. Just over two in five (43%) of women who are employed part-time work fewer than 16 hours per week.
For women in 2008:5
- 20% of those employed part-time prefer to work more hours;
- younger part-time employees are more likely than older part-time employees to prefer working long hours - longer working hours are preferred by:
- 28% of those aged 15-24 years
- 25% of those aged 25-34 years
- 19% of those aged 35-44 years
- 18% of those aged 45-54 years
- 12% of those aged 55-64 years
- 5% of those aged 65 years and over; and
- among those working short part-time hours (fewer than 16 hours per week), 24% would prefer to work more hours, while among those working 16-34 hours, 18% would prefer to work more hours.
Maternal employment and age of youngest child
The main influence on the lower employment rate of women in their late twenties and thirties is the effect of childbearing. Employment rates are lowest immediately following the birth of a child and then increase as mothers re-enter the workforce. Part-time work predominates for women in these age groups.
The best source of data on the employment of mothers with an infant is Growing Up in Australia: The Longitudinal Study of Australian Children. Figure 3 shows the proportion of mothers who have returned to work, and the hours they worked, across age groups of infants aged up to 14 months.6
- For mothers of infants aged:
- 3-5 months, 23% had returned to work;
- 6-8 months, 31% had returned;
- 9-11 months, 39% had returned; and
- 12-14 months, 45% had returned.
- Mothers were most likely to be working fewer than 16 hours per week when employed with a 3-5 month old child (13% working less than 16 hours, 6% working 16 to 34 hours and 4% 35 hours or more). As the infant approached his or her first birthday, a greater proportion of mothers worked longer part-time hours.
- Full-time work also increased, but at a slower rate. Among the mothers of infants aged 12-14 months, 9% were employed full-time hours.
Figure 3: Mothers' employment and hours worked by age of infant, mothers of infants, 2004
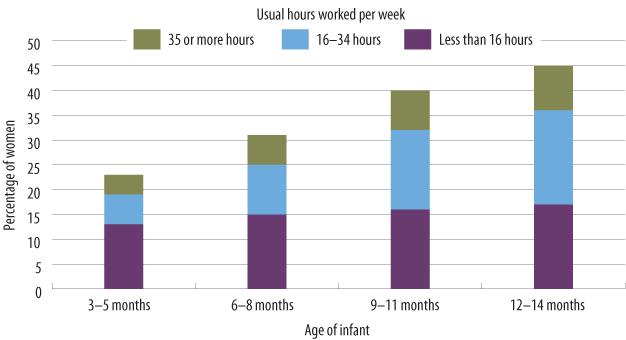
Source: LSAC Wave 1, infant cohort (2004).
Employment of single and partnered mothers
Maternal employment rates increase as children grow up. But other events can also lead to changes in parents' participation in paid employment. In particular, family separation can have a major impact upon maternal employment, with single mothers having a much lower employment rate than partnered mothers, particularly while children are young. According to data from the ABS Labour Force Survey in 2007:7
- Among partnered mothers with children aged less than 5 years, 51% were employed (35% part-time and 16% full-time). The employment rate for single mothers with children aged less than 5 years is 34% (23% part-time and 11% full-time).
- For partnered mothers with a youngest child aged 5-9 years, 71% were employed (44% part-time and 27% full-time), while for those with a youngest child aged 10-14 years, 78% were employed (41% part-time and 37% full-time).
- For single mothers with a youngest child aged 5-9 years, 58% were employed (35% part-time and 23% full-time), while for those with a youngest child aged 10-14 years, 68% were employed (36% part-time and 32% full-time).
Working hours of fathers with young children
The average working hours of fathers with a 4-5 year old child is 47 hours per week. One quarter of fathers usually work 55 hours or more per week.8
The long work hours of full-time workers has implications for the work-family balance and, not surprisingly, many of these workers would prefer to work fewer hours. Two of every five (40%) of full-time employed fathers say they would prefer to work fewer hours. Among fathers working 55 hours or more per week, 61% prefer to work fewer hours (Baxter, Gray, Alexander, Strazdins & Bittman, 2007).
Self-employment and working at home
For mothers, self-employment is often taken up as a means of combining work with family responsibilities, while fathers are less likely to take up self-employment for these reasons (Gray & Hughes, 2005). Often self-employment is undertaken, at least in part, from home. The 2006 ABS Time Use Survey provides information on the extent that different groups are self-employed and whether that employment was done more at home than elsewhere.9
Figure 4 shows that:
- a relatively high proportion of women worked predominantly at home when they had a child aged less than 5 years (22% of those employed), either as employees (12%) or in self-employment (10%);
- a smaller proportion of mothers with an older child worked predominantly at home as an employee (4% of those employed), although 7% worked predominantly at home in self-employment;
- while males were often self-employed, they were more likely to be doing this work in locations other than at home; for example, of the men with a child aged under 5 years, 15% were self-employed, including only 2% who worked predominantly at home; and
- few male employees worked predominantly at home; for example, of the 85% of employed men with a child aged under 5 years who were employees, only 2% worked more at home than elsewhere.
Figure 4: Employed males and females, percentage who are working at home and/or are self-employed (own account workers or employers) by life cycle stage, 2006
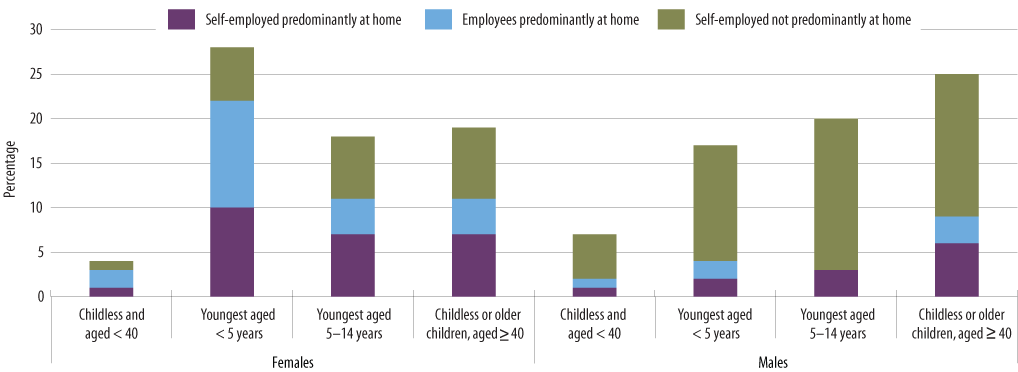
Note: Self-employed workers are those defined as own account workers or employers, and excludes people self-employed in their own incorporated business, who are classified as employees.
Source: ABS 2006 Time Use Survey.10
Conclusion
Both paid employment and family responsibilities are a part of many people's lives. The nature of both of these varies across the life course. Changes in life stage, such as the birth of a child or the need to care for a sick family member often requires adjustments be made to paid employment. The more we know about the strategies people use to manage this balance, the better informed we will be in developing appropriate policies that help families at all stages of life.
References
- Baxter, J., Gray, M., Alexander, M., Strazdins, L., & Bittman, M. (2007). Mothers and fathers with young children: Paid employment, caring and wellbeing (Social Policy Research Paper No. 30). Canberra: Department of Families, Community Services and Indigenous Affairs.
- Gray, M., & Hughes, J. (2005). Caring for children and adults: Differential access to family-friendly work arrangements. Family Matters, 70, 18-25.
- OECD (2007). OECD employment outlook, 2007.
1 Cat. No. 2068.0 - 2006 Census tables, 2006 Census of Population and Housing, Australia, labour force status by age by sex for time series, count of persons aged 15 years and over, based on place of usual residence.
2 OECD (2007) and OECD online employment statistics database.
3 Full-time employment is defined as working more than 34 hours per week.
4 Cat. No. 2068.0 - 2006 Census tables, 2006 Census of Population and Housing, Australia, labour force status by age by sex for time series, count of persons aged 15 years and over, based on place of usual residence.
5 ABS Monthly Labour Force data (ABS Monthly Labour Force spreadsheets, February 2008).
6 Data from the Longitudinal Study of Australian Children (LSAC), 2004.
7 ABS Monthly Labour Force data, Families Spreadsheets, June 2007.
8 Data from the Longitudinal Study of Australian Children (LSAC), 2004.
9 ABS 2006 Time Use Survey, calculated from the Confidentialised Unit Record File CD-ROM.
10 ABS 2006 Time Use Survey, calculated from the Confidentialised Unit Record File CD-ROM.
Baxter, J., & Gray, M. (2008). Work and family responsibilities through life (Facts Sheet). Melbourne: Australian Institute of Family Studies.
16 May 2008