Employment of men and women across the life course
Overview

This Facts and Figures summarises information about employment participation, work hours, unemployment and underemployment, with a focus on gender and age differences, to capture variation between men and women and across the life cycle. See also Family Employment for trends and patterns related to parents’ employment.
Male and female labour force participation by age
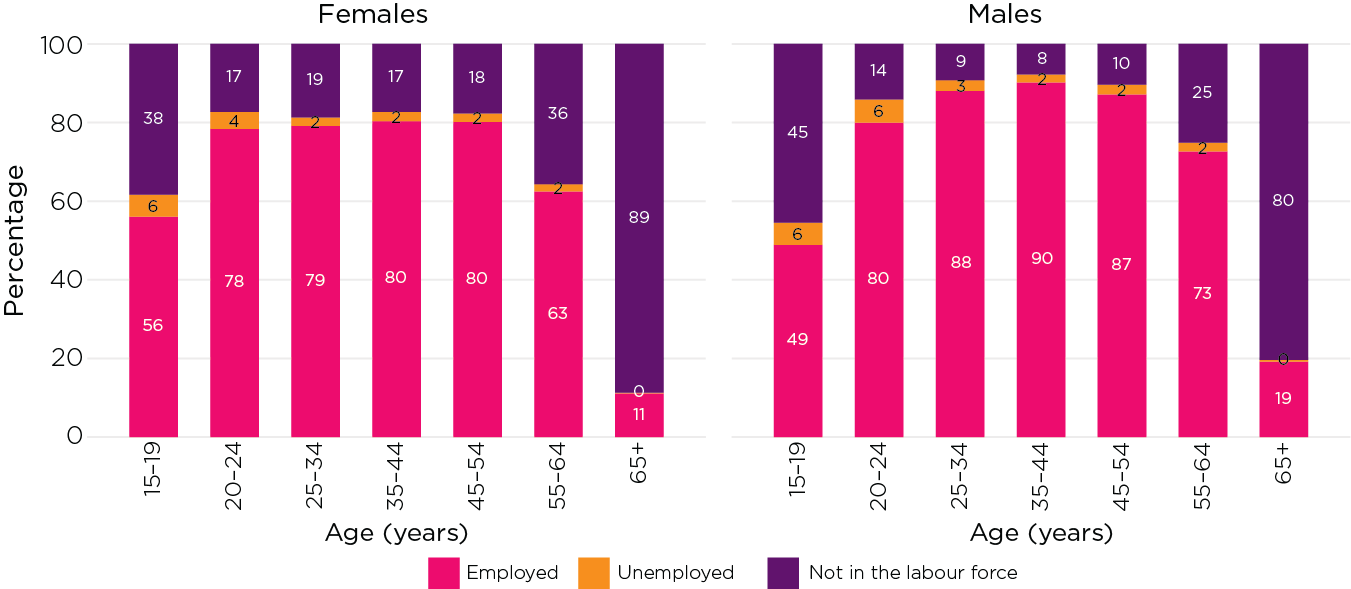
Figure 1 shows labour force participation by age and gender for June 2022, with variation by age showing young people’s transition into employment through to people’s retirement at older ages.1
Women are less likely to be employed compared to men from young adulthood, reflecting that women are more likely than men to adjust work to balance work with caring responsibilities, particularly following childbearing and when children are young (see also Family Employment). Among the employed, there are also differences in work hours by age and gender. These are explored in ‘Work hours of men and women by age’.
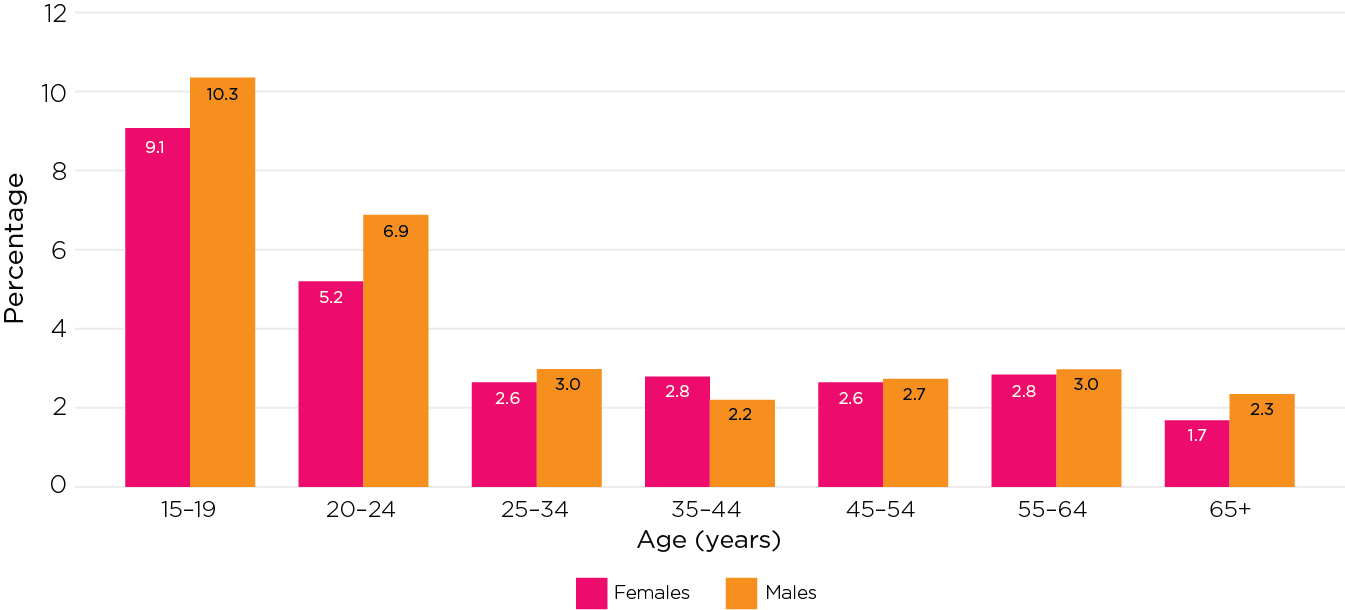
Figure 1 also shows the proportion of men and women who are unemployed by age. Unemployed people are counted as part of the labour force, as they are actively seeking employment. Unemployment is often tracked using the unemployment rate, which is the number unemployed as a percentage of the total labour force (Figure 2). There are much higher unemployment rates among young people, and the unemployment rate tends to be higher for males.
The remainder shown in Figure 1 are those ‘not in the labour force’. This can be for a range of reasons, including study, care for children or others, or being retired or unable to work. The higher proportion of ‘not in the labour force’ at younger ages relates to those participating in study, while the higher proportion at older ages is indicative of retirement from the labour force.
Figure 1: Labour force patterns vary by age and sex.
Labour force status of men and women by age, 2022
Source: June 2022, ABS, Labour Force, Australia, Detailed, November 2022
Figure 2: Unemployment rates are highest for young people.
Unemployment rates of men and women by age, 2022
Source: June 2022, ABS, Labour Force, Australia, Detailed, November 2022
Trends in employment participation
Long-term trends
Overall, over the past 40 years, there have been significant changes in the composition of Australia’s active workforce. There have been large increases in the employment participation of women, who comprised 48% of the total employed in 2022, compared to 36% in 1979 (see Figure 3).
Several social and demographic changes have contributed to women’s increased participation in employment (see Baxter, 2013a). This includes:
- the management of fertility through increased use of contraception (ABS, 2003)
- changes in educational attainment and fields of study such that women are now able to participate and progress in a wider variety of jobs
- increased availability of flexible working arrangements, particularly part-time work, and greater availability of child care and maternity leave.
Compared to the trend in employment rates for women, which shows considerable growth, the trend for men over the past 40 years is much less apparent. Nevertheless, between 1977 and 1997, there were declines in the labour market in industries traditionally employing full-time male workers, such as utilities, mining and manufacturing. At the same time, the female-dominated service industries increased substantially. This resulted in a drop in employment rates for men across all age groups (Commonwealth Treasury of Australia, 1999).
- In 1978, 75% of men aged 15 years and over were employed, compared to 65% in 1992, 70% in 2002 and 2012, and up to a relatively high proportion of 74% again in 2022.
For both men and women, the period from the late 1970s reveals the relationship between the economic climate and employment rates (see the shaded areas in Figure 3). There have been falls or stalled growth in employment at particular times, such as during the recessions in the 1980s and 1990s and the Global Financial Crisis in 2007–08. The impact of the COVID pandemic is also apparent, with a dip in employment around the beginning of restrictions in 2020.
Figure 3: The growth in female employment over 40 years is more significant than the changes in male employment.
Employment participation rates of males and females, 1978–2022

Source: June 1977 to June 2022, ABS, Labour Force, Australia, Detailed, November 2022
Trends in female employment by age
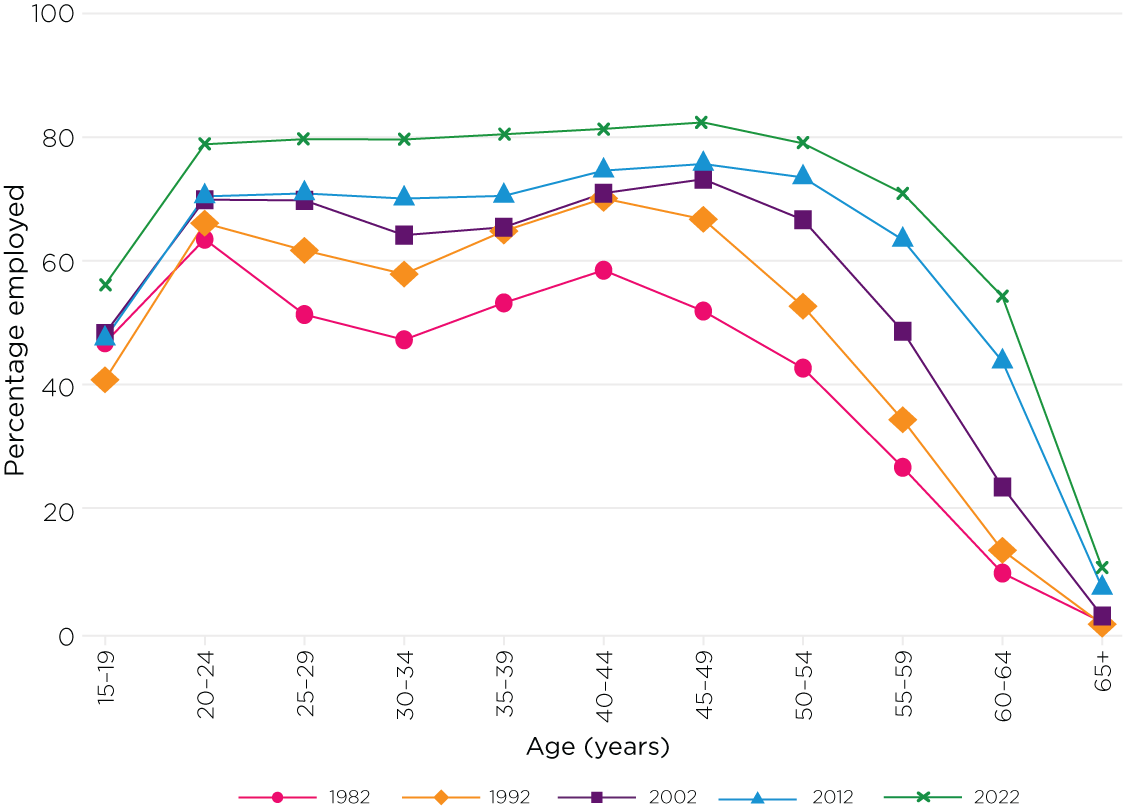
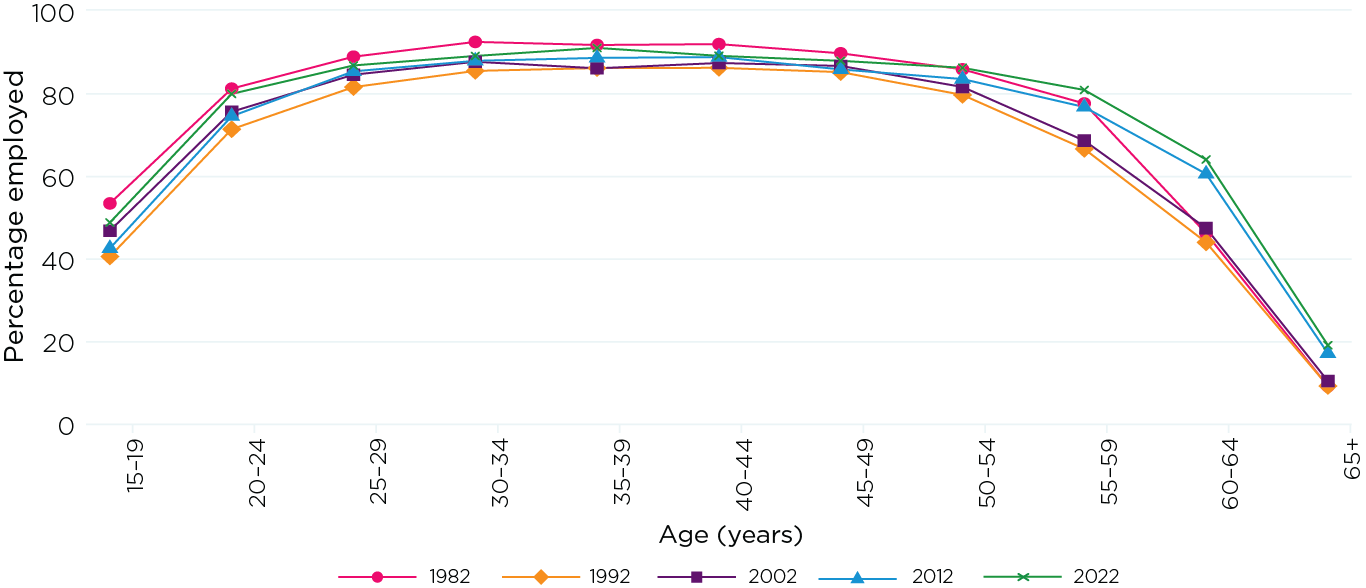
Figure 4 shows that in 1982, female labour force participation had an ‘M-shaped’ distribution. It was lowest among women aged 24–35 years, then higher between ages 35 and 49 years, before dropping as women retired. Since then, significant increases in female employment can be seen for those aged in their 20s and 30s. In 2012 and 2022, there was no longer a dip in women’s labour force participation around childbearing age.
Figure 4: Female employment participation rates by age no longer show a dip around during the childbearing years.
Female employment participation rates by age, selected years 1982–2022
Source: June data from selected years, ABS, Labour Force, Australia, Detailed, November 2022
There have also been changes in female employment at older ages. In 2022, the proportion of women employed at 50–54 years is almost the same as the proportion employed at 45–49 years, and it has become more common for women to continue in the workforce until their late fifties or early sixties. Figure 4 shows the dramatic increases in female employment between 1982 and 2022 at older ages:
- at 55–59 years, from 27% employed in 1982, 49% in 1992 to 71% in 2022
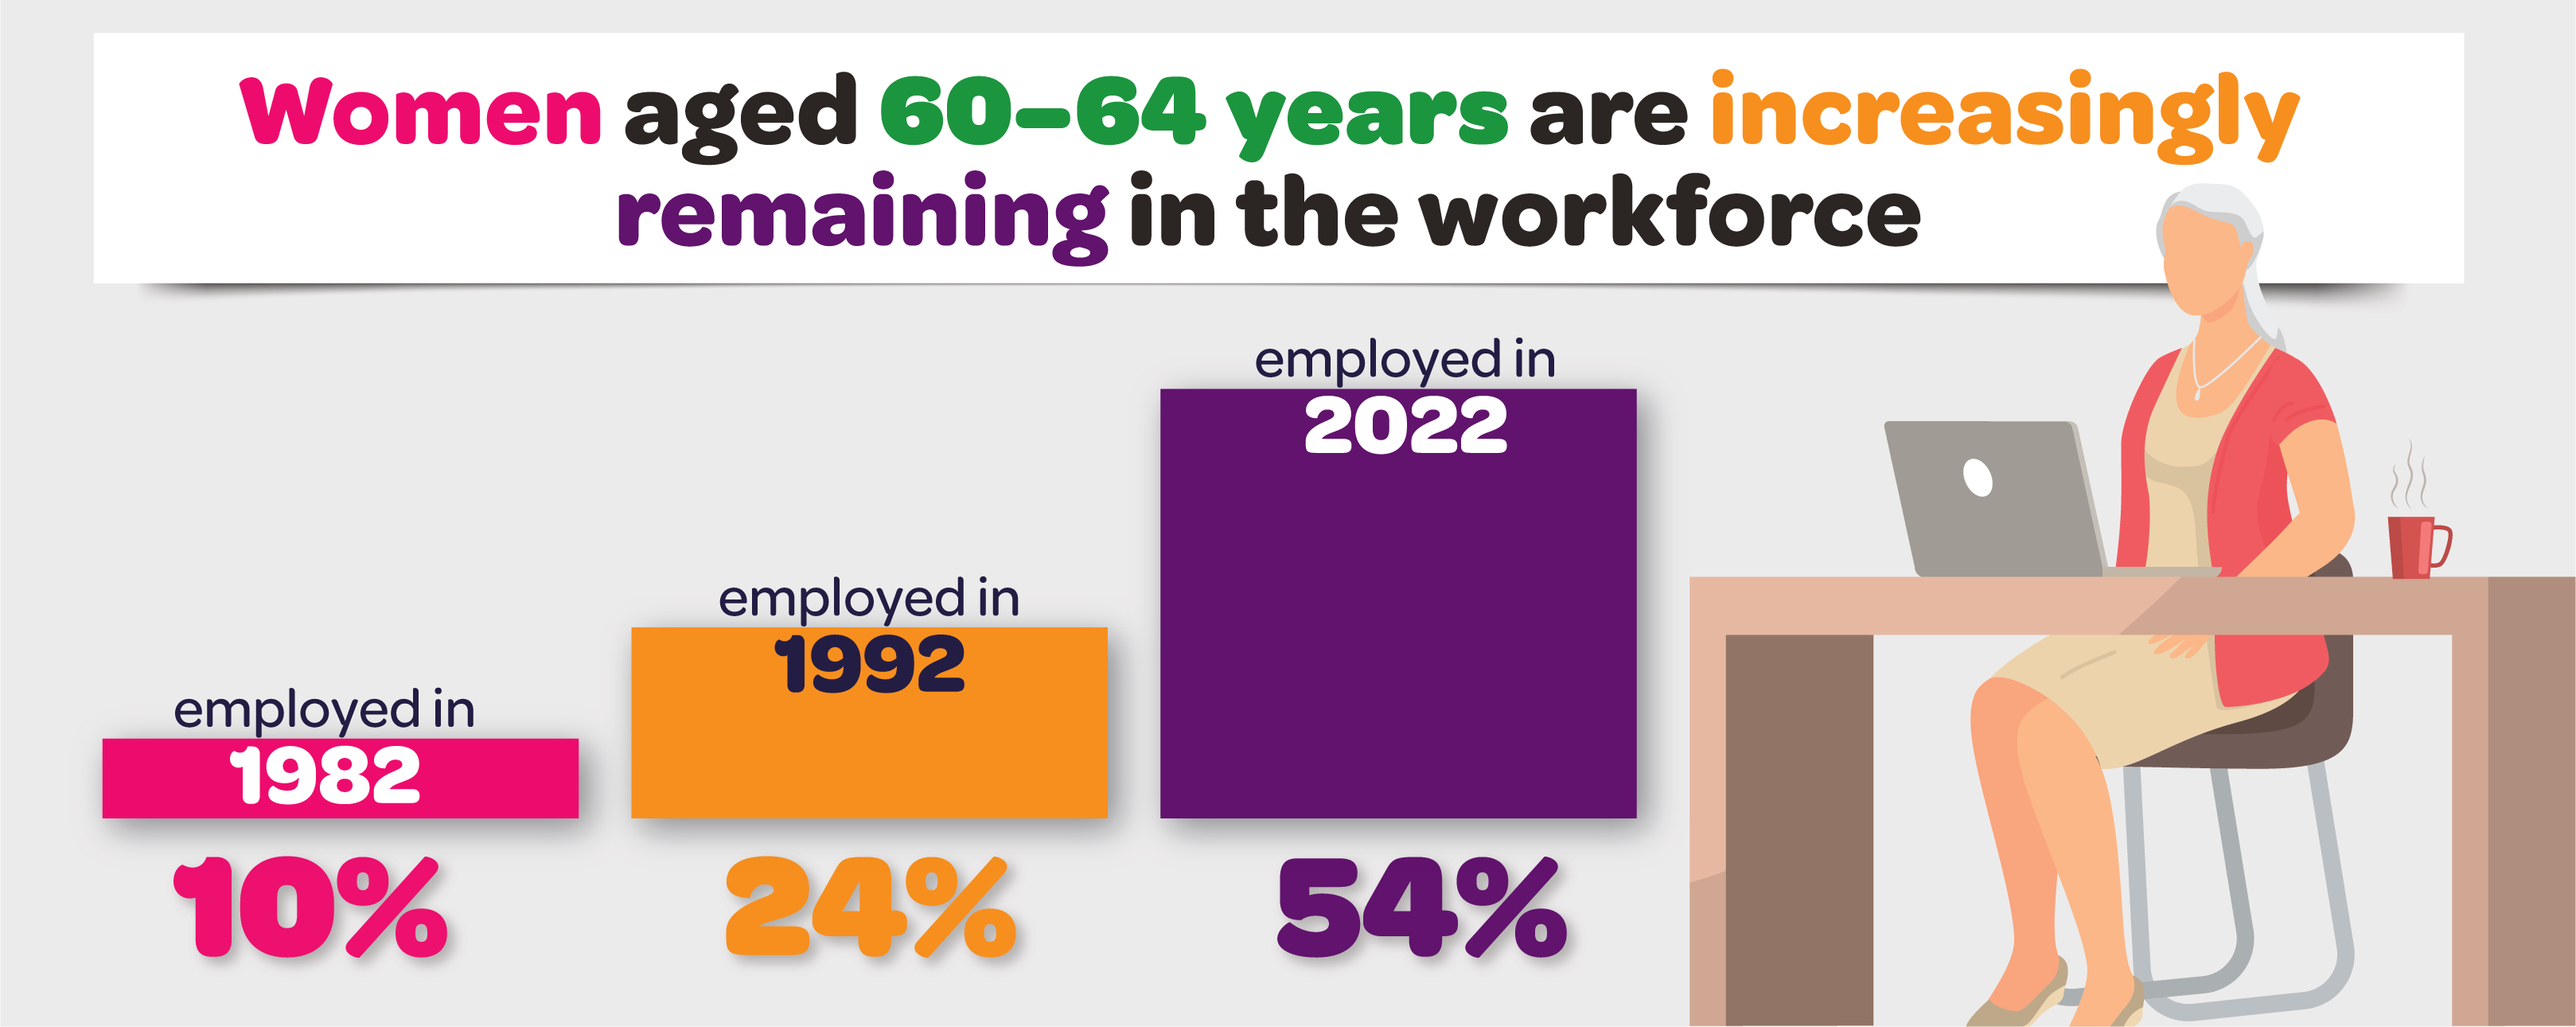
- at 60–64 years from 10% employed in 1982, 24% in 1992 to 54% in 2022.
The social and demographic trends mentioned earlier have contributed to women having a stronger connection to employment across their lifetime, through to retirement age.
The trends are also partly due to changes in the qualifying age for the age pension. In 1995, the qualifying age for women was gradually increased from age 60, so that by July 2013 it was 65. Since 2017, the qualifying age for the Age Pension for men and women has been progressively increased from age 65 to be 67 in 2023.
Trends in male employment by age
Men’s participation in employment typically does not vary with parenthood, so their employment participation across life stages is much more stable. After the ages at which men enter the labour force, up until the ages they are typically leaving it, there is little variability (Figure 5). At the lower and upper end of the age range there have been some changing patterns over the years:
- More young men in recent years are participating in post-school education, and many are delaying entry into the labour force until their twenties.
- Like women, men are retiring later, with 19% of men aged 65 or older employed in 2022, up from 9% in 1982.
Figure 5: Males’ employment participation varies little between the ages of 25 and 54 years.
Male employment participation by age, selected years 1982–2022
Source: June data from selected years, ABS, Labour Force, Australia, Detailed, November 2022
Women’s relationship status and employment
In decades past, there were differences in women’s employment according to their marital status, with married women prevented from working in some occupations. Now, women’s relationship status, on its own, is not expected to be associated with marked employment differences, although it can capture the impacts of children on employment participation. See Family Employment for analysis of employment of parents.
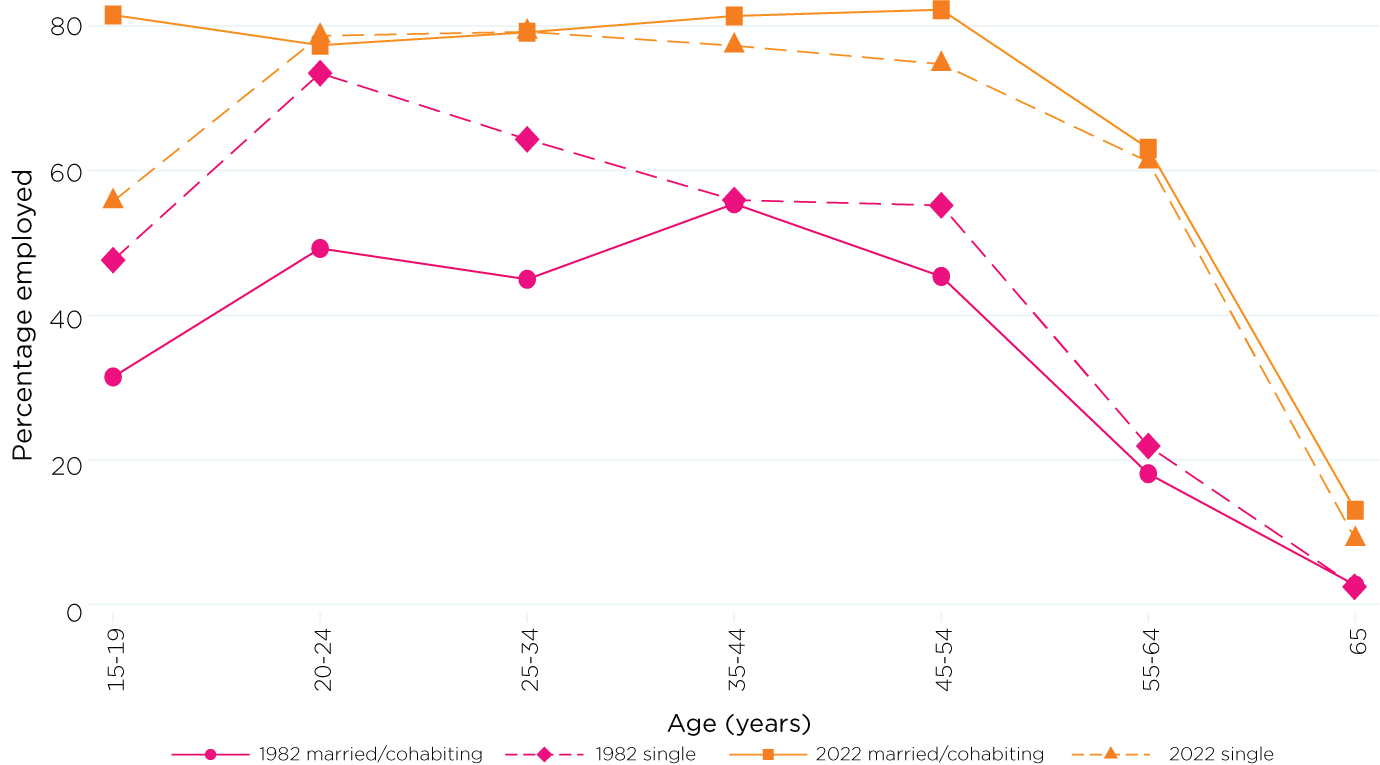
Differences according to relationship status and broad age group are shown in Figure 6 for 1982 and 2022. The variable used is ‘social marital status’, in which partnered includes married and cohabiting.
- In both 1982 and 2022 there was a marked difference in the employment rates of 15–19 year old young women according to social marital status. The employment rates for single 15–19 year old women were similar in 1982 and 2022. But compared to single women in this age group, the employment rates were lower for partnered women in 1982, and higher for partnered women in 2022. This is expected to reflect changes to family formation over this period, with partnered 15–19 year olds in 1982 more likely to have had a first child compared to those in 2022.2
- In 1982, there were marked differences in employment participation between single women and couple women at ages 20–24 years and 25–34 years, with single women much more likely to be employed. By 2022, there were no real differences at these ages, with much higher rates of employment among partnered women than there had been in 1982:
- This will to some extent reflect demographic changes. See, for example, Fertility and Marriages, which show that in 1982, many of the partnered women at these ages were married and having children. By 2022, especially among the younger age group, many partnered women would have been in cohabiting relationships and would not have started parenthood.
Figure 6: At most ages, there is little difference now between single and partnered women’s employment.
Single and partnered women’s employment by age, 1982 and 2022
Source: June 1982 and June 2022, ABS, Labour Force, Australia, Detailed, November 2022
Work hours of men and women by age
Hours worked by sex and age
Just as there are life-cycle and gender differences in rates of employment participation, there are also differences in work hours. Men’s participation in employment across the life course is mostly in full-time work, as shown in Figure 7, while women’s employment is much more likely to include some part-time work.
- For young men and women (under 25 years), part-time work is relatively common, as young people fit their work around study.
- Part-time work is also used at the older ages and can be a way to transition to retirement.
- Higher proportions of women than men work part-time hours across the life course, largely as a means of balancing work and care responsibilities. See also Family Employment for more details about parents’ work hours.
Figure 7: Female employment at all ages is more often part-time than full-time, while male employment at all but the youngest ages is more likely full-time.
Percentage working full-time and part-time by age and sex, 2022
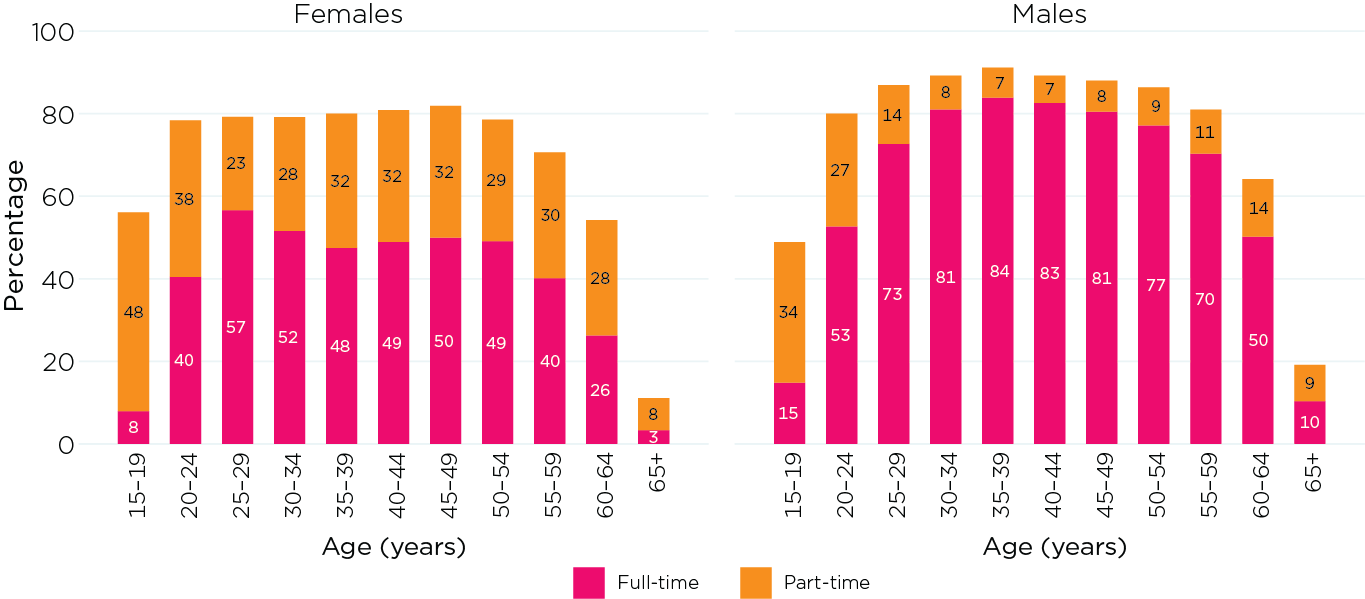
Notes: The percentages in full-time and part-time work add to the total percentage employed. Part-time work is less than 35 hours per week, and full-time work is 35 hours or more per week.3
Source: June 2022, ABS, Labour Force, Australia, Detailed, November 2022
Trends in hours worked by sex and age
With increased levels of female employment, rates of both full- and part-time work are higher for women now than they were 40 years ago (Figure 8). The proportion of women working part-time has doubled, from 14% in 1982 to 26% in 2022, while increases in full-time work have been more gradual over the 40-year period. Within the past 10 years, the growth in the numbers of women in full-time work has been more substantial than the growth in part-time work.
The percentage of men who worked full-time was considerably higher 40 years ago than it is today. In 1982, for example, less than 5% of men worked part-time. In 2022, part-time work is still much less common for men than for women but rates of part-time work have increased (up to 13% of men working part-time in 2022).
Figure 8: Much of the growth in female employment has been in part-time work.
Percentage working full-time and part-time by sex, selected years, 1982–2022
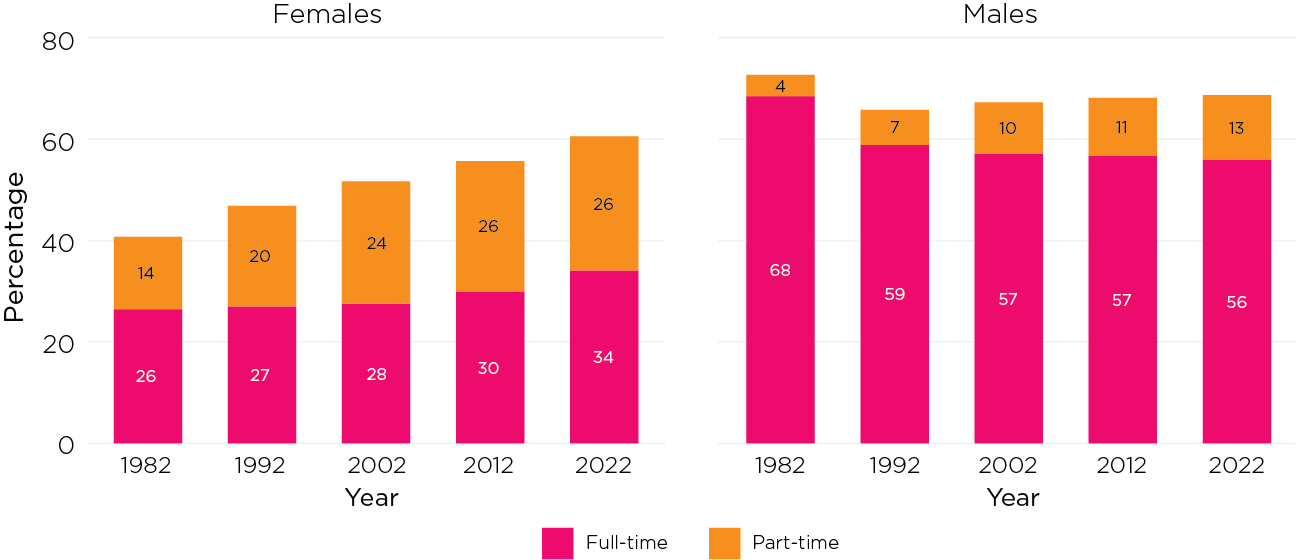
Source: June data from selected years, ABS, Labour Force, Australia, Detailed, November 2022
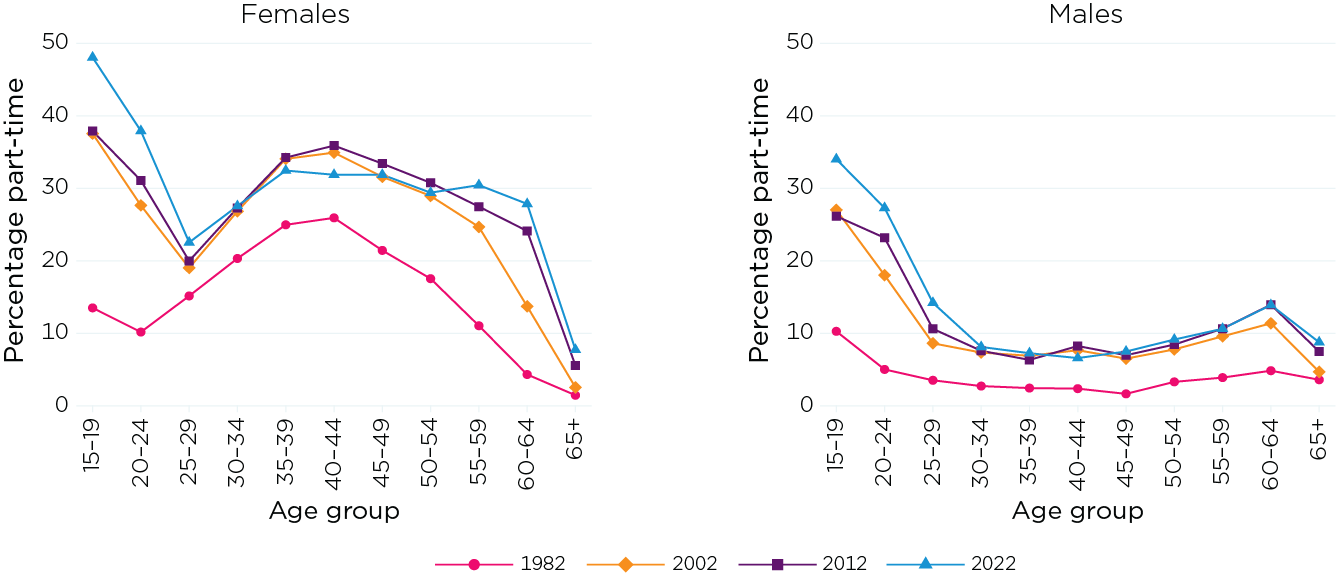
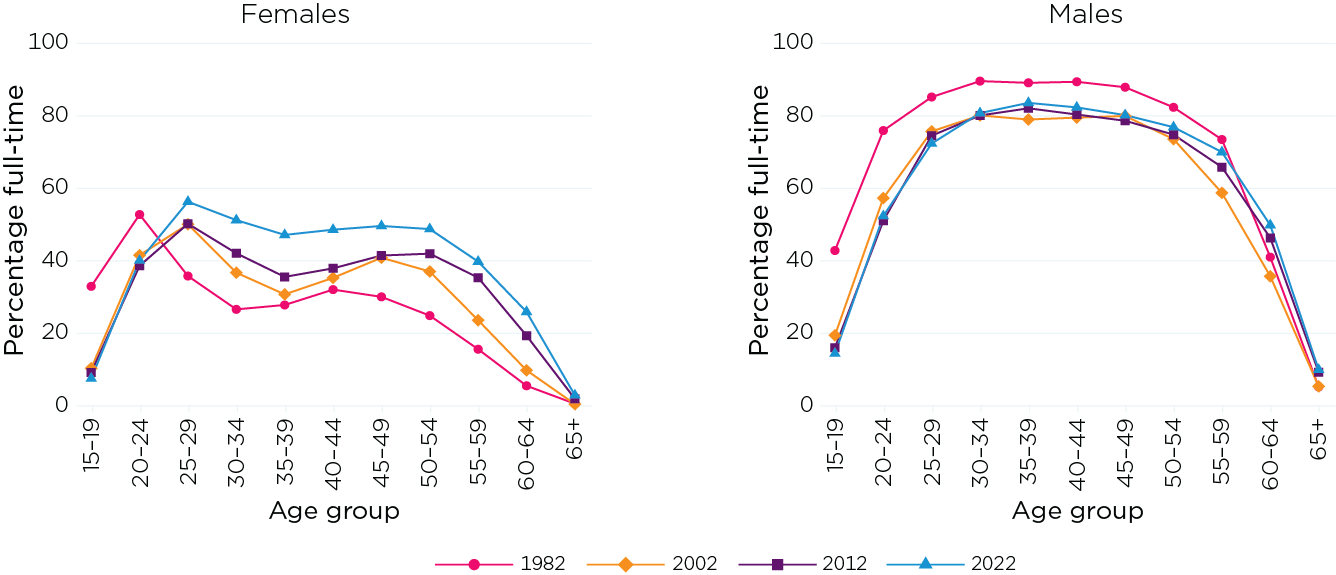
When trends are examined within broad age groups, there have been significant changes in work hours for the youngest women and men (Figure 9). Up to the early 1980s, more worked full-time in their teens and early twenties than they do today. Now, more start their employment participation by working part-time while studying, before moving to full-time work in their mid-twenties.
Between 1982 and 2002, the growth of part-time work for women in the childbearing and childrearing years can be seen. But since 2002, the growth in part-time work for these ages has been minimal. There has, however, been continued growth in the proportion working full-time across these ages.
There have also been changing patterns of work attendance for women at the older ages. With each decade, there has been growth in full-time and part-time employment among women aged 55–59 years and 60–64 years.
For men, there was increased uptake of part-time work between 1982 and 1992 at all ages, with a slight trend to more part-time work among men aged 55 years and over in recent decades.
Figure 9: Full-time and part-time work patterns across the life course vary much more for women than they do for men.
Percentage of females and males working full-time and part-time by age, selected years 1982–2022
Source: June data from selected years, ABS Labour Force, Australia, Detailed, November 2022 | Australian Bureau of Statistics (abs.gov.au).
Note: Note different scales for full-time work and part-time work.
Underemployment
Some of the patterns related to part-time work reflect underemployment – men or women working part-time hours when they would prefer to be working more hours. Overall, in February 2022:
- 26% of male part-time workers and 18% of female part-time workers were underemployed; that is, they preferred to work more hours and were available to work more hours.
- Of the male underemployed part-time workers, 58% preferred to work full-time hours. For females, 41% preferred full-time hours.
Underemployment (like unemployment) is more common at the younger ages. Figure 10 shows, for 2022, the proportion working part-time hours divided into those who were underemployed and those who were not. The older men and women working part-time hours were the most unlikely to be underemployed.
Figure 10: Underemployment is more common for younger part-time workers.
Part-time work and underemployment by age and sex, 2022
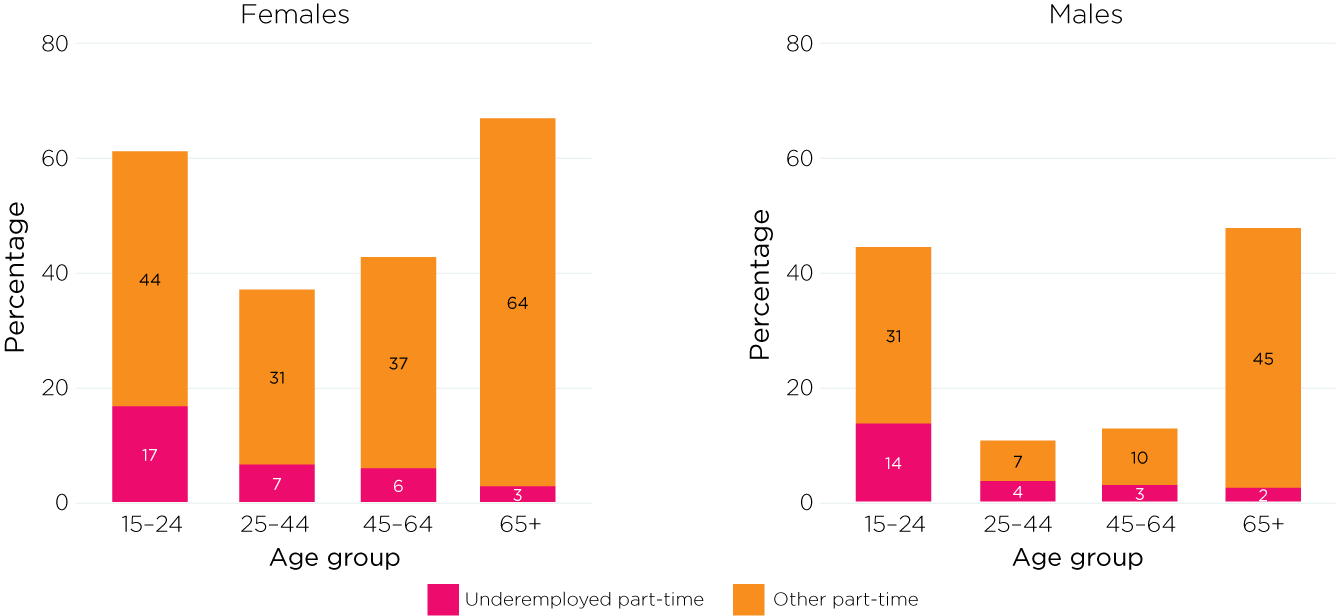
Notes: Underemployed part-time workers are those who were underemployed and available to work more hours.
Source: ABS, Underemployment, February 2022, Table 3. Underemployed workers, May 2022
Summary
Employment participation continues to vary considerably across the life course, with more marked life-course impacts for women. While in decades past this impact was apparent in women’s withdrawal from employment during the years of bearing and raising children, it is now more in the uptake of part-time work during these years. The trends are showing increases in women’s participation in full-time work also. At older ages, there is a trend toward retiring later for women and men, with significant increases in the proportion of women and men employed in their fifties and early sixties in particular.
References
Australian Bureau of Statistics. (2003). Paid work: Changes in labour force participation across generations. Australian Social Trends 2003 (Cat. No. 4102.0). Canberra: ABS. Retrieved from www.abs.gov.au/Ausstats/[email protected]/0/ 4d240d4bbc0e533cca2570ec00006eed?OpenDocument
Baxter, J. (2013a). Employment and the life course: analyses of birth cohort differences of young Australian women. In Evans, A., & Baxter, J. H. (Eds.), Negotiating the life course: Stability and change in life pathways (pp. 99–120). Springer, Netherlands.
Commonwealth Treasury of Australia. (1999). Recent movements in the labour force participation rate. Economic Roundup (Summer). Canberra: Commonwealth of Australia
Data sources
The primary data source is ABS labour force data, extracted November 2022. Most data are derived from 6291.0.55.001 - LM1 - Labour force status by Age, Greater Capital City and Rest of State (ASGS), Marital status and Sex, February 1978 onwards. Labour Force, Australia, Detailed, November 2022 | Australian Bureau of Statistics (abs.gov.au). June data were used for all analysis of employment and unemployment. Estimates may differ slightly to those published elsewhere as percentages derive here exclude those with missing data on age, sex, marital status, region or labour force status.
Additional February 2022 data (extracted November 2022) were used for the analysis of underemployment. Underemployed workers, May 2022 | Australian Bureau of Statistics (abs.gov.au)
1 Employed persons are those who worked at least one hour during the reference week or others who had a job but were away from work that week. To be classified as unemployed a person needs to be not working more than one hour in the reference week, actively looking for work in previous four weeks; and be available to start work in the reference week. The not in the labour force category comprises those who not employed or unemployed. For more detail see 6102.0.55.001 - Labour Statistics: Concepts, Sources and Methods, Feb 2018 (abs.gov.au)
2 Deriving estimates from the 1982 ABS Labour Force Characteristics of Families Survey, out of 29,700 married 15–19 year old women, 56% had dependent children. From the equivalent 2022 survey, an estimated 1,000 married/cohabiting women aged 15–19 years had children (13%) and another 6,600 did not have children. Labour Force Status of Families, June 2022.
3 Employed full-time: Includes employed persons who usually worked 35 hours or more a week (in all jobs) and those who, although usually working less than 35 hours a week, worked 35 hours or more during the reference week. Employed part-time: Includes employed persons who usually worked less than 35 hours a week (in all jobs) and either did so during the reference week or were not at work in the reference week. Source: ABS
© GettyImages/ablokhin
18 May 2023
