Employment patterns and trends for families with children
Key messages
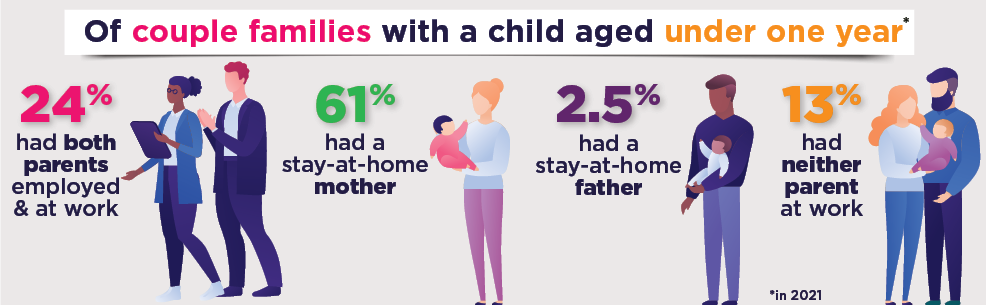
- Within couple families, there remain gendered patterns of employment, with mothers much more likely than fathers to reduce employment to care for young children. The proportion of mothers employed, though, continues to increase. In 2022, both parents were employed in 71% of couple families with children under 15 years. This compares to 56% in 2000 and 40% in 1979.
- Within couple families, the proportion with both parents working full-time hours is increasing (31% in 2021, up from 22% in 2009), although it remains more common for one parent to be full-time and the other part-time (36% in 2021, this proportion changing little since 2009).
- Mothers are least likely to be employed when they have a child aged under one year (60% of couple mothers and 29% of single mothers with a child aged under one year in 2021). The employment rate then increases when the youngest is one year old (69% of couple mothers and 38% of single mothers with a youngest child aged one year in 2021). Beyond this, the increase in employment is gradual as children grow (up to 81% of couple mothers and 71% of single mothers with a youngest child aged 14 years in 2021).
- While employed, many mothers of under-one year olds are working zero hours. The zero hours group is likely to be largely those on parental leave or other kinds of leave to care for newborns. The proportion employed but away from work in this group has increased significantly over the years (from 5% in 1991 to 32% in 2021). This increasing proportion away from work explains the large increase in employment for mothers of under-one year olds, which almost doubled from 30% to 57% between 1991 and 2021. There was virtually no change in the proportion employed and working some hours in this period.
- Although employment growth continues for both single and couple mothers, single mothers are still less likely to be employed than couple mothers. This difference in employment rates, in 2021, was greatest when the child was aged 0-2 years (a gap of 29%), compared to a gap of 21% for mothers of 3-5 year olds and 12% for mothers of 6-14 year olds.
- Stay-at-home father families are not common, as captured by fathers who are not employed and mothers who are employed. This was 3.8% of families in 2022. Fathers' employment does not vary with the age of the youngest child, unlike mothers' employment, but there are some significant differences in employment rates when couple and single fathers are compared, with single fathers more often in part-time work.
- Same-sex couple parents have work patterns that are similar to opposite-sex couple parents, although there are gendered differences between male and female same-sex couples. Same-sex mother families are more likely to have one parent working part-time compared to same-sex father families, where there is a higher proportion of both parents working full-time.
Introduction
Raising children requires careful balancing of caring responsibilities with the demands of employment. Families approach this in diverse ways, and often change their approaches as children grow. Overall, though, work patterns of parents remain highly gendered. This research paper explores these patterns, focusing on the employment patterns of parents at the family level as well as separately for mothers and fathers.
This research is particularly relevant in the context of gender, from both a workplace perspective and a family perspective. It highlights the vast differences between mothers and fathers in the ways that they engage with the labour market. While this continues to change, with mothers increasingly in employment, including full-time work, compared to decades past, there is still a divide between mothers and fathers. Fathers' employment patterns, by comparison, have changed little over the decades. One factor that continues to be relevant is the gender wage gap, that means if families are making decisions about who should reduce work hours to care for children based on finances, the optimal arrangement will in many families be for fathers to work full-time and for the mothers to reduce hours of employment (Baxter, 2018).
The gendered employment patterns also reflect ongoing gendered norms around caring for children. While attitudes have shifted to there being more acceptance of working mothers, when faced with new parenthood, many mothers and fathers will adopt 'traditional' gendered patterns that then persist over subsequent years of raising children. While there has been a shift towards preferences for more equal sharing of roles, the ideal of women being primarily responsible for the home and men for earning the income remains the preference in some families, especially among parents with caring responsibilities (Baxter, 2015; van Egmond, Baxter, Buchler, & Western, 2010).
Further research will explore the different ways that mothers and fathers are engaging in employment, and the barriers and enablers to that employment. This report, however, is important in helping us understand the overall employment patterns.
This research complements earlier AIFS research covering different aspects of parental employment. See the bibliography at the end of this report for other AIFS publications published in the past 10 years. The research sits alongside other sources of information on gender and employment, including publications by the Australian Bureau of Statistics (ABS, see e.g. Changing female employment over time), the Workplace Gender Equality Agency (WGEA, see e.g. Gender equality workplace statistics at a glance 2022) and the Parliamentary Library (see Women in the Australian workforce - Parliament of Australia).
Much of the research presented in this report focuses on opposite-sex couple parent families, with some additional analysis of single parents' employment and same-sex families' employment. At June 2022, there were 2.7 million families across Australia with children aged 0-14 years. Of these families, 80% were opposite-sex couple parent families, 16% were single-mother families, 3% single-father families and 1% same-sex families.1,2
Data sources are primarily the ABS Labour Force Status of Families Survey (up to 2022 for most analysis, some only to 2021) and the ABS Census of Population and Housing (five-yearly 1991-2021).3 The census data are used for more detailed analysis of parental employment. The focus is on families with children under 15 years.
Couple families and employment
Strong growth in parental employment over time
Figure 1 presents the parental employment trend from 1979 to 2022 for couples with children aged under 15 years.
Figure 1: A majority of couple families now have both parents employed.
Couple parents’ employment patterns, 1979–2022
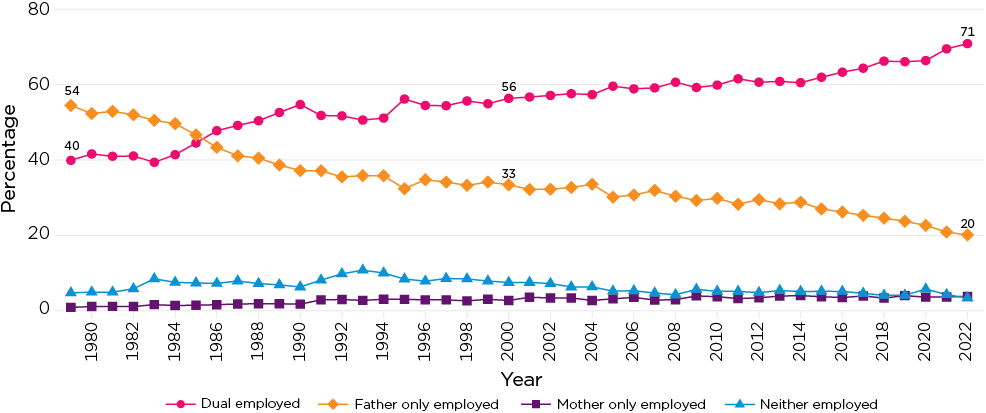
Notes: Data relate to couple families with children aged <15 years. Data are for July for 1979-85, then for June each year from 1986. There were breaks in series over this period (see Labour Force Status of Families methodology, June 2022). This chart combines series A from 1979 to 1985, series B from 1986 to 1993, series C from 1994 to 2004 and Series D from 2005 to 2022. In the case of same-sex couples, the ABS codes the younger partner's labour force status to mothers' labour force status and the older partner's labour force status to fathers' labour force status. Excludes those with 'not stated' labour force status.
Source: ABS Labour Force Status of Families, data downloads, Table 3
1979-89
Within the first part of this time period, up to the end of the 1980s, the proportion of couple families that had both parents employed grew strongly. This largely follows the growth in maternal employment over this period (see 'Mothers' employment' and Baxter (2013a)) and reflects family, workplace and societal factors such as:
- changes in contraception, fertility and partnering patterns, which has seen women spending more time in employment as they delay starting families. This early 'investment' in employment has led to women having a stronger labour market connection that persists after parenthood. Smaller family sizes have also made it easier for parents to manage employment while bringing up children.
- women's higher levels of education, which has led to expanded opportunities for women in the labour market.
- contextual changes including labour market changes such as the increased availability of part-time work; the introduction of relevant legislation (the Sex Discrimination Act in 1984, Affirmative Action (Equal Employment Opportunity for Women) Act 1986) and progress on gender wage equality; and the introduction of relevant policies (attention to the availability and cost of child care, increased parental leave for public servants in 1985).
- families needing two incomes to meet living expenses; in particular, the cost of housing.
The 1990s to today
From the 1990s, there has been a more gradual increase in the proportion of couple families with both parents employed, and a decline in the proportion with a stay-at-home mother. The proportion with both employed, referred to as dual-employed, was 71% in June 2022 compared to 60% in 2010, 56% in 2000 and 55% in 1990. In comparison, around 40% were dual-employed in the early 1980s.
- The proportion of families in which the mother was not employed while the father was employed (often referred to as 'stay-at-home mother families') was 20% in June 2022, compared to higher rates in earlier years. For example, the proportion was 30% in June 2010, 33% in 2000 and 37% in 1990.
- The proportion of families in which the father was not employed while the mother was employed (referred to as 'stay-at-home father families') was no more than 4% over this period, with the percentage less than 3% in the 1980s. See also AIFS' Stay-at-home fathers in Australia for detailed analysis about stay-at-home fathers in Australia. The proportion of stay-at-home father families in 2022 was 3.8%.
- The proportion of jobless families - that is, neither parent employed - was 3% in June 2022, following proportions between 4% and 6% each year from June 2003. The highest jobless rates in couple families over this data series were reported for June 1992, 1993 and 1994 when the proportions were 10%-11%.
Changes in family formation patterns, education and costs of living continued to be relevant to these trends in this period. Further significant workplace policy changes during this period included the introduction of Paid Parental Leave and Dad and Partner Pay.
Dual employment of parents increasingly means both in full-time work
Figure 1 showed that since the mid-1980s, dual-employed couples are more common than stay-at-home mother families and the proportion of dual-employed families has continued to rise. Within these families, the majority have at least one parent working full-time hours, and in the past decade the proportion that are both working full-time has been increasing. It is likely that this trend is, to some extent, related to families' needs for two incomes to meet their costs of living, including housing costs.
In contrast, the proportion of families in which one parent is working full-time and one part-time has fluctuated between 35% and 38% over this period, with no apparent trend. This is shown for a more limited time series in Figure 2. Full-time work is defined as 35 hours or more per week.4
Figure 2: In dual-working families there is a growing number of both parents working full-time.
Dual-working couples and work hours, 2009-21
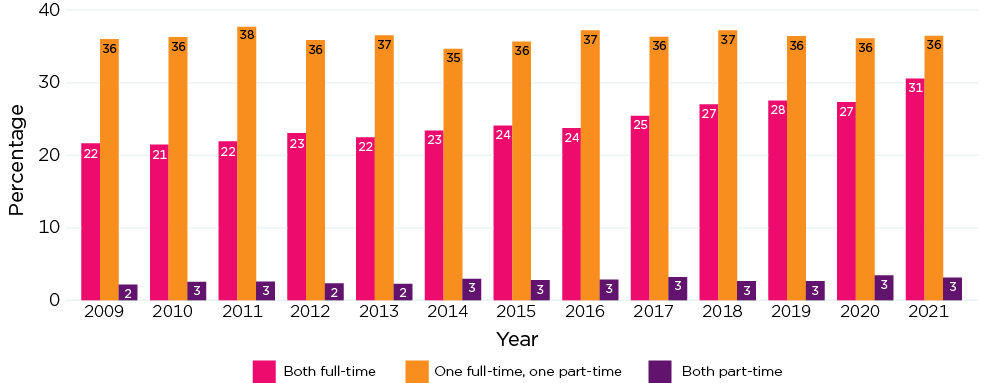
Note: Data relate to couple families with children aged <15 years.
Source: ABS Labour Force Status of Families, 2009 to 2021, TableBuilder
Putting these work hour patterns for dual working families together with other family employment patterns, overall for couple parents with children under 15 years in 2022:
- 31% had both parents working full-time hours
- 36% included one parent working full-time and the other working part-time
- 26% included one not employed and the other employed (full-time or part-time)
- 3% had both working part-time hours
- 4% had neither parent employed
Gendered patterns in dual-working families
Just as the 'stay-at-home' parent is more often the mother than the father (see Figure 1), there is also a gendered pattern to employment within dual-working couples. For example, of the 1.5 million couple families with children with both parents employed in 2021:5
- 44% were made up of both male and female employed full-time
- 48% had the male employed full-time and the female part-time
- 3% had the female was employed full-time and the male part-time
- 4% had both employed part-time.
Age of youngest child is key to employment patterns
Parents often change their employment participation as children are born. In most families, this involves mothers leaving work for a period, including taking leave. Mothers then often return to part-time work, at least for a time when children are young. See 'Mothers' employment' for more details.
Figure 3 shows how employment patterns vary for families with a youngest child aged 0-4 years, 5-9 years or 10-14 years, with much higher rates of couples having one parent at home when there is a youngest child aged less than 5 years. The rates of both working full-time are lower in this group, compared to those with older children. Even when the youngest child is aged 5-9 years or 10-14 years, about one in five families have a stay-at-home parent.
These family employment patterns are driven largely by the increase in maternal employment as children grow.
Figure 3: There are more stay-at-home parents when children are under 5 years.
Couple parents' employment patterns by grouped age of youngest child, 2021
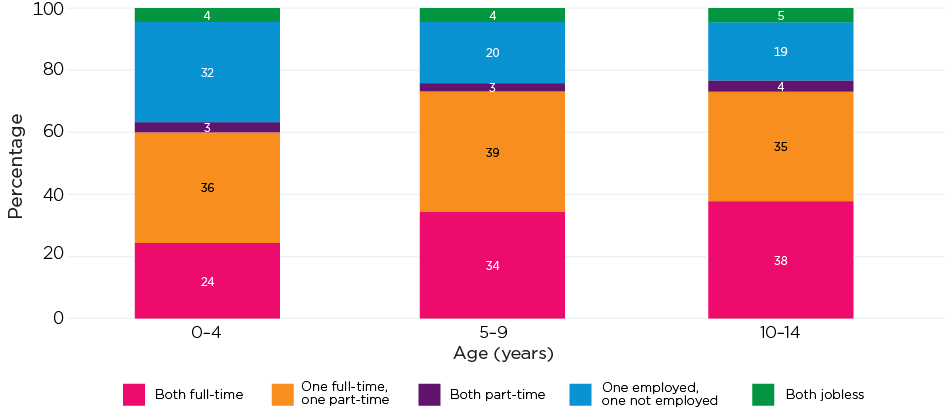
Notes: Data relate to couple families with children aged <15 years. The 2022 data were not available in TableBuilder at the time this report was prepared. Percentages may not total exactly 100% due to rounding.
Source: ABS Labour Force Status of Families, 2009 to 2021, TableBuilder
Couple parents' employment varies by ages of children
Looking at employment by children's ages in single years is especially useful for families with very young children, highlighting patterns of mothers' return to work after childbearing.6 This is done in this section, extending the above analysis and using census data. Couple families' employment data for 2021 are shown in Figure 4.
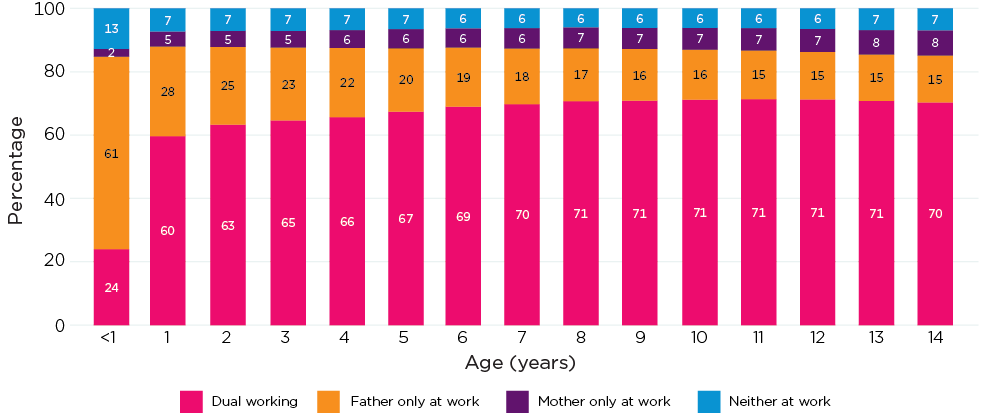
- Parents' employment patterns vary as children grow, and there are gradual increases in parents being employed by the age of the youngest child. The largest increases in employment occur from age under-one year to one year. However, there is no dramatic increase when the youngest child turns school age.
- The key change is the increase in mothers being employed and families gradually becoming more likely to be dual-employed families.
Figure 4: As children grow, the key change is growth in mothers' employment.
Couple parents' employment patterns by age of youngest child (years), 2021
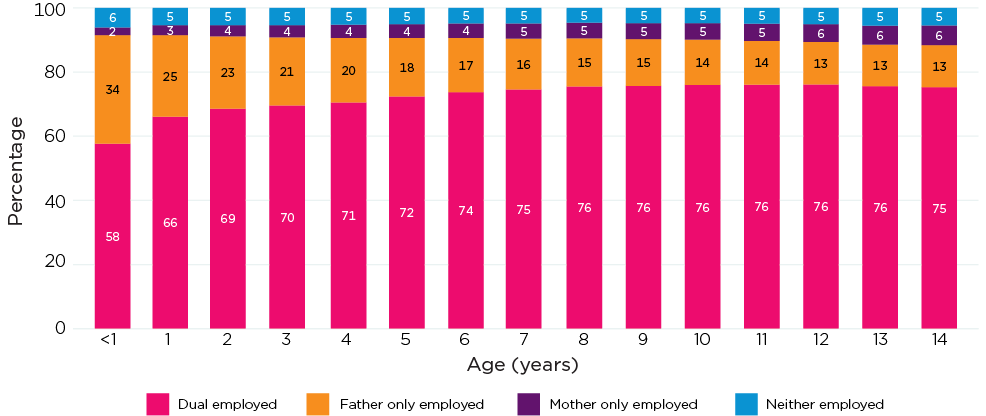
Notes: Data relate to couple families with children aged <15 years. Percentages may not total exactly 100% due to rounding.
Source: ABS Census of Population and Housing custom data request, families with children aged less than 15 years.
Adjusting for working zero hours better explains parents' work patterns
Information about parents' employment tells us about which mothers and fathers have a job at the time of the census. More insights can be gained by looking at work hours; in particular, taking account of employed parents who are on leave or working zero hours at the time of the census. Those working zero hours are employed, and this connection to the labour market through having a job differentiates them from others counted as not employed. However, circumstances are quite different for families when a parent is working zero hours rather than working hours that may require additional care arrangements for children to be in place. It is therefore important to consider this 'zero hours' category as distinct from the 'not employed' and also distinct from those 'working [more than zero hours]'. The distinction is especially important when children are very young, and mothers often take an extended absence from their employment. For example, for mothers with a youngest child aged under one year, working zero hours likely reflects paid or unpaid maternity or parental leave.
For all families with children, consideration of working zero hours makes some difference but for families with very young children this difference is much more marked. This is demonstrated below for couple families with children aged under 15 years, and the subset of those with a child under-one year of age.
| Labour force derivation | Reclassifying zero hours | |
|---|---|---|
| Couples with children <15 years | 71% both parents employed 24% one parent employed 5% neither parent employed | 62% both parents employed working >0 hours 31% one parent employed working >0 hours 7% neither parent employed working >0 hours |
| Couples with child <1 year (subset of the above) | 58% both parents employed 36% one parent employed 6% neither parent employed | 24% both parents employed working >0 hours 63% one parent employed working >0 hours 13% neither parent employed working >0 hours |
When families have one parent at home, this parent is usually the mother.
The 2021 couple-level work patterns by age of youngest child are shown in Figure 5. As described above, in these data those working zero hours are counted as not working. This shows:
- The patterns are similar to those using the parental employment variable; the main variation in employment between the ages of children relates to mothers' employment.
- Only small proportions of couple families have both parents not working. The highest proportion is when there is a youngest child aged less than one year. This includes those parents that are still employed but on leave from work.
- 'Stay-at-home father' families make up a small proportion of families, especially among those with a youngest child aged less than one year, reflecting the strong likelihood that mothers will take time out of work to care for newborns.
Figure 5: Taking account of zero hours highlights the high rates of stay-at-home mothers when families have children under one year.
Couple parents' work patterns, by age of youngest child (years), 2021
Notes: 'Work' is employed and working more than zero hours. Excludes families in which either parent's labour force status was not stated. Percentages may not total exactly 100% due to rounding.
Source: ABS Census of Population and Housing custom data request, families with children aged less than 15 years
Figure 6 takes this further, to include parents' work hours.
- Those with a youngest child under-one year of age have very different work patterns to others, with about half the couple families comprising mothers not working and fathers working full-time.
- The proportion with this work pattern halves for those with a youngest child aged one year, with a large increase in the proportion of families with mothers in part-time work and fathers in full-time work.
- The proportion of 'stay-at-home mothers' with full-time working fathers then decreases slowly as children grow, with increases apparent for both working full-time hours.
Around 18% of couple families have 'other' hours combinations. The most common work hours combinations within 'other' are both working part-time hours (5.1% in 2021); fathers working part-time hours and mothers not working (3.6%); and fathers part-time hours and mothers full-time hours (3.5%).
Figure 6: Parental work hours change gradually once children are one year or older.
Couple parents' work hours by age of youngest child, 2021

Notes: Full-time is 35 hours or more a week; Part-time work is 1-34 hours a week. 'Work' is employed and working more than zero hours. Excludes families in which either parent's labour force status was not stated. Percentages may not total exactly 100% due to rounding.
Source: ABS Census of Population and Housing custom data request, families with children aged less than 15 years.
Work trends for families with children under 3 years
The analysis here presents trends in family employment for couple families with children under 3 years. Figure 7 compares 2021 to earlier census years. (More insights on family employment trends come from the analysis below on mothers' employment.)
- Within families with a child aged less than one year:
- The proportion dual working (i.e. both employed and working more than zero hours) has changed little from 1991 to 2021, at 26% in 1991 and 24% in 2021.
- The proportion in which only the father is at work is higher in 2021 compared to 1991 and 1996, with the difference in part explained by there being a higher proportion of jobless in the 1990s compared to later years.
- For families with a youngest child aged one year:
- There has been a considerable increase in the proportion of parents both working, up from 40% in 1991 to 60% in 2021.
- With this increase, there has been a corresponding decline in the proportion of families with only the father in work, from 44% in 1991 to 28% in 2021.
- The pattern is much the same for families with a youngest child aged two years, with increases across this period in the proportion of families with both parents in work.
Figure 7: Parental work trends differ for parents with a child aged under one year.
Work patterns in couple families with children under 3 years by age of youngest child, 1991-2021
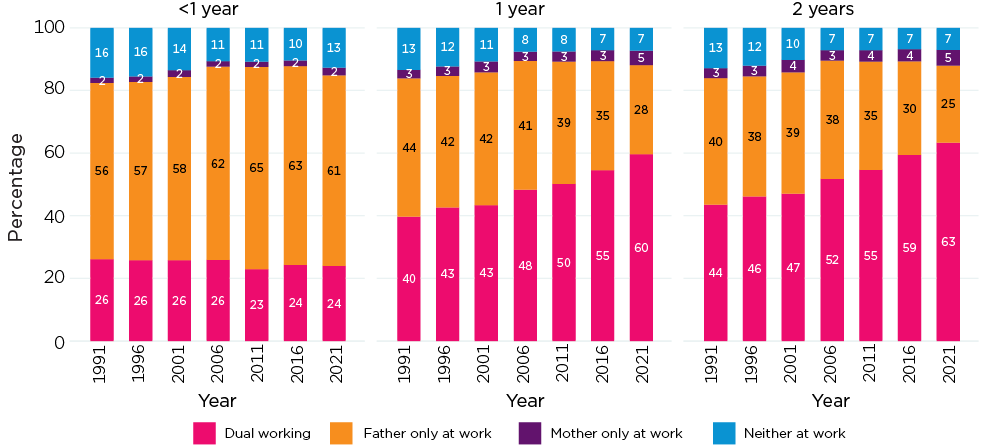
Notes: 'Work' is employed and working more than zero hours. Excludes families in which either parent's labour force status was not stated. Percentages may not total exactly 100% due to rounding.
Source: ABS Census of Population and Housing custom data request, families with children aged less than 3 years.
Figure 8 takes this trend analysis a step further, incorporating parents' work hours.
- For families with an under-one year old, the most common work arrangement is the father in full-time work and the mother not in work. The proportion in this category was 52% in 2021, the same as 1991 and 2001. The patterns have changed little over these census years, compared to the changes for those with somewhat older children.
- For couples with a youngest child aged 1-2 years, the key changes are in the growth in the proportion of families with the father employed full-time and the mother part-time, and a corresponding decline in the proportion with the father full-time and the mother not in work.
Figure 8: There are marked increases in part-time work but not for new parents.
Work hours in couple families with children under 3 years by age of youngest child, 1991-2021
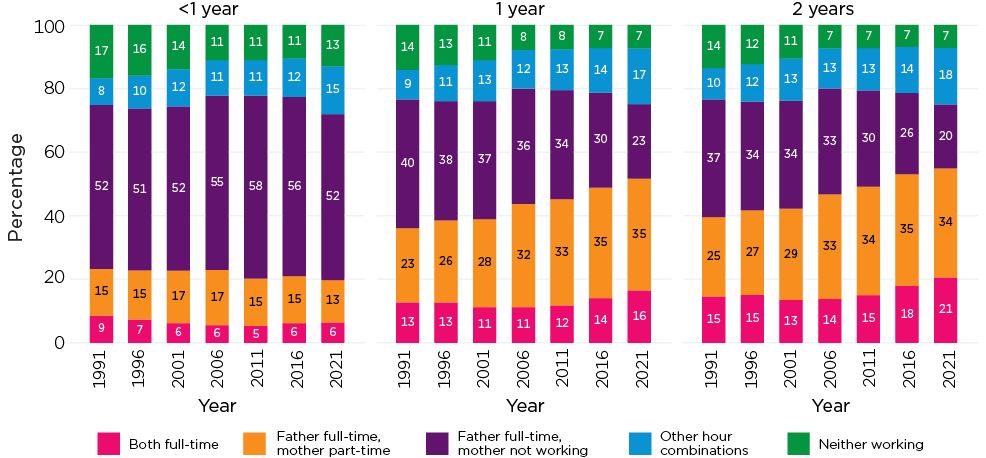
Notes: Full-time is 35 hours or more a week; Part time work is 1-34 hours a week. 'Work' is employed and working more than zero hours. Excludes families in which either parent's labour force status was not stated. Percentages may not total exactly 100% due to rounding.
Source: ABS Census of Population and Housing custom data request, families with children aged less than 3 years.
For all these groups, there has been some increase in the proportion of couples having other combinations of work hours. Overall, for couples with children aged under 3 years:
- The most common combination of work hours within 'other' was that of fathers working part-time hours and mothers not working (6% of couple families with a child aged under 3 years in 2021, up from 4% in 1991).
- The next largest group was that of both parents working part-time hours (5% in 2021, up from 2% in 1991).
Mothers' employment
As mentioned above, much of the variation over time and across families in parental employment patterns reflects the differences in mothers' employment. This is explored in this section, covering trends, differences for single and couple mothers, and differences by age of youngest child. This section differs to the above in that it includes single mother families as well as couple parent families. Fathers' employment is examined in the following section.
Employment varies with relationship status and age of youngest child
Connection to the labour force is typically measured using labour force status, which classifies people as employed (including working zero hours), unemployed (those who are not employed but actively seeking work and available to start) or the remainder classified as not in the labour force. The patterns by age of youngest child are clear for single and couple mothers (Figure 9). If employed, about half the mothers work full-time hours and half part-time hours, with variation according to age of youngest child - full-time hours more likely as children grow older.
Few mothers are unemployed, with mothers who are not working much more often classified as not in the labour force. Somewhat more single mothers are unemployed compared to couple mothers.
Figure 9: Single mothers are less likely to be employed than couple mothers.
Labour force status of mothers with children <15 years by relationship status and age group of youngest child, 2022
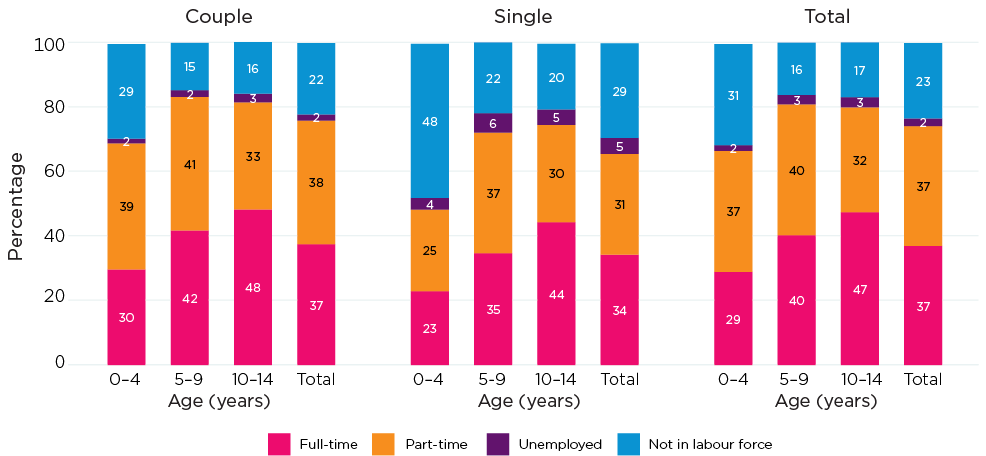
Source: ABS Labour Force Status of Families, data downloads, Table 3.
Differences between couple and single mothers' employment are most apparent for mothers with a child under 5 years, with any employment more likely at this stage for couple mothers. This likely reflects the greater ease of being able to combine work and family if child care can be shared between two parents, as well as reflecting different characteristics of couple and single mothers.
The difference in characteristics of single and couple mothers can be seen in relation to educational attainment, for example. Comparing couple and single mothers with a child aged less than 15 years in 2016 and 2021:
- In 2016, 37% of couple mothers and 17% of single mothers had a bachelor degree or higher.
- In 2021, the proportions were higher for both at 44% of couple mothers and 24% of single mothers.
Those with a bachelor degree or higher had a higher likelihood of being employed in each of these years. Drawing on the census data:
- In 2021, 82% of couple mothers and 83% of single mothers with a bachelor degree or higher were employed. The figures were 78% and 80% respectively in 2016. Note the similarity of employment rates among single and couple mothers with a bachelor degree or higher.
- In 2021, 69% of couple mothers and 54% of single mothers without a bachelor degree or higher were employed. The figures were 64% and 49% respectively in 2016. Note the lower employment rates of single mothers among those without a bachelor degree.
Other factors are relevant in explaining the differences in single mothers' and couple mothers' employment.7 More detailed research about the barriers and enablers to employment, with a focus on explaining the recent increase in single mothers' employment, would be of benefit.
The employment gap between single and couple mothers remains
One of the most significant social changes over recent decades is the increased labour force participation of mothers, as was seen in the earlier analyses of family employment. Figure 10 shows that employment participation has increased for single mothers as well as couple mothers since the late 1970s, the beginning of this data series.
Figure 10: There have been increases in employment for both couple and single mothers.
Percentage employed, couple and single mothers with children aged under 15 years, 1979-2022
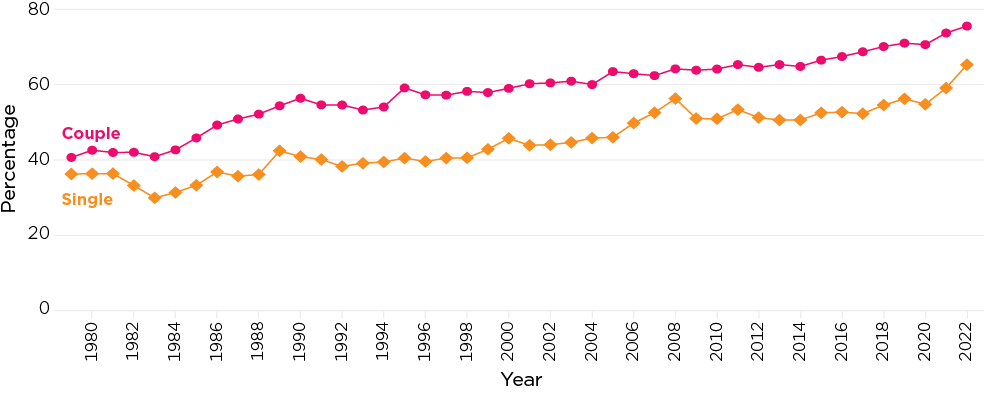
Source: ABS Labour Force Status of Families, data downloads, Table 7.
There is a lower employment rate for single mothers, compared to couple mothers at each point in the time series. In some periods, there has been a more marked increase in the employment of single mothers. This has been the case in recent years, from 2020 to 2022, and was also the case in the period 2005-08.
The employment rates of couple and single mothers increased considerably between the 2016 and 2021 Censuses - this growth is apparent in Figure 10. Here some additional labour force data are examined to look further at this trend, using quarterly data collected from 2019 to 2022, and some of the earlier annual data. These more detailed data cover the period of the COVID pandemic and associated restrictions. Figure 11 shows:
- For couple mothers, the employment rate stayed at around 71% from the March 2019 quarter to the September 2020 quarter. From the December 2020 quarter to the March 2022 quarter, the employment rate was a touch higher, varying between 72% and 74%. It was higher in the June 2022 quarter, at 76%.
- There is more variability from month to month for single mothers, and there was a marked decline in employment rates from September 2019 (61%) to September 2020 (down to 53%). After this, the employment rate sat at 59% for four quarters, to September 2021, and has increased since then, potentially catching up from the dip in the trend around the time of the COVID restrictions.
Figure 11: Overall employment patterns persisted over COVID.
Percentage employed, couple and single mothers with children aged under 15 years, June 2016-June 2022
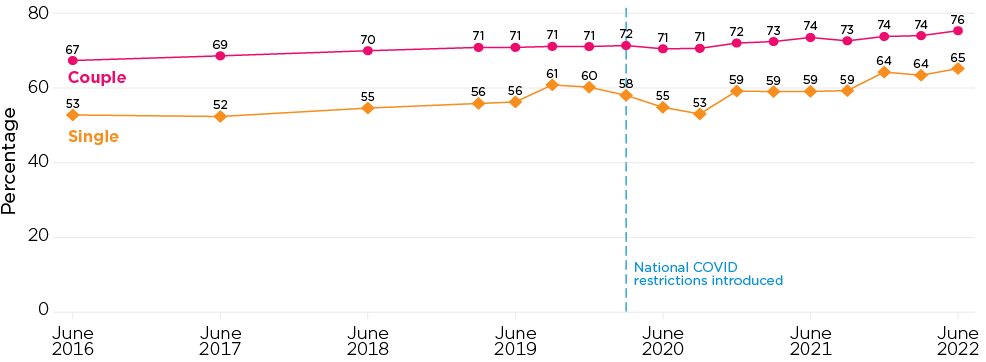
Source: ABS Labour Force Status of Families, data downloads, Table 7.
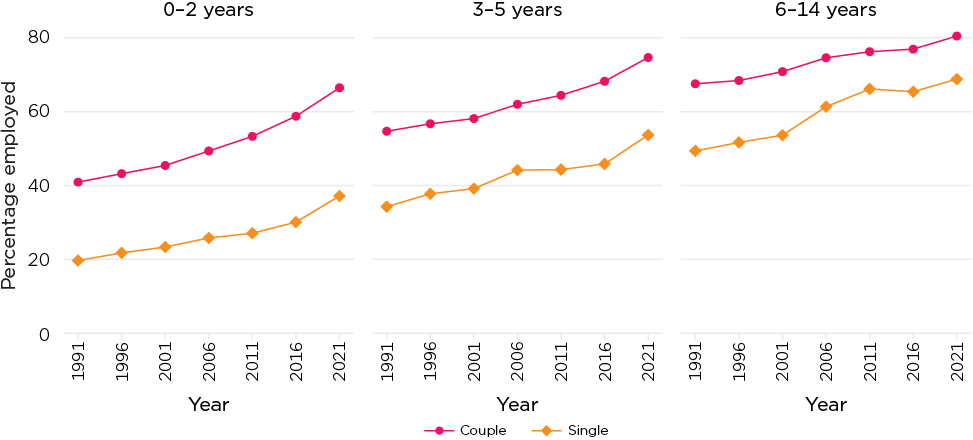
The employment gap between single and couple mothers is greatest for those with younger children
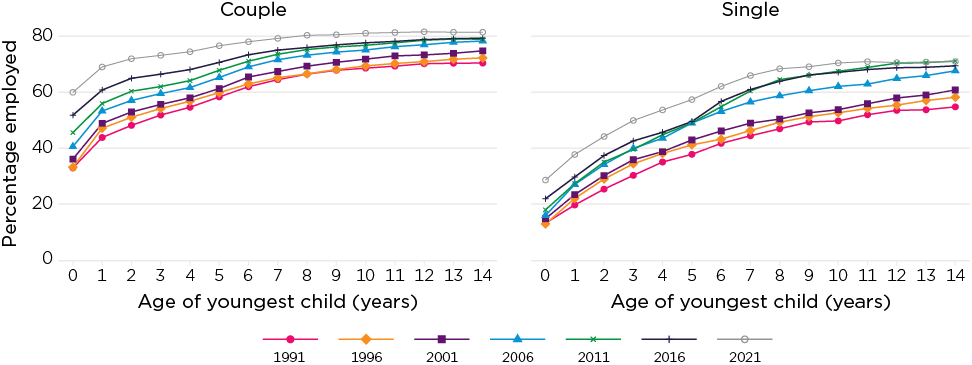
Using the census data for 1991 through to 2021, mothers' employment participation by age of youngest child and year is shown for couple mothers and single mothers in Figure 12. These data present the percentage employed, which includes those employed but working zero hours. Another view of this is shown in Figure 13, aggregating the ages of youngest children and allowing comparison of the employment rates of single and couple mothers.
- Across single and couple mothers there is a gradient by age of youngest child that is most marked when children are very young. It flattens out once the youngest child is around 8 years old, indicating that transitions back to work are more often happening when children are younger.
- The proportion employed has generally increased across census periods, although the extent of change varies by age of youngest child and period - with no change apparent for some age groups at certain times.
- The notable increase in maternal employment between 2016 and 2021 is apparent for couple mothers and single mothers at most child ages.
- Compared to couple mothers, the proportion of single mothers employed is lower at each age of youngest child, in each of the census years.
- There was a considerable closure in this gap for mothers of 6-14 year olds between the 2001 and 2006 Censuses, then again at the 2011 Census. Figure 12 shows the increases in single mothers' employment at this time. This coincided with some major policy changes in 2003 and 2006 that included the introduction of activity tests for those receiving income support payments at particular ages of children (see Baxter & Renda, 2011).
Some key statistics from Figure 12:
- In 2021, 60% of couple mothers and 29% of single mothers with a child aged under 1 year were employed. This compares to 33% and 13% in 1991 respectively.
- In 2021, 69% of couple mothers and 38% of single mothers with a youngest child aged 1 year were employed. This compares to 44% and 20% in 1991 respectively.
- At the other end of the age range, in 2021, 81% of couple mothers and 71% of single mothers with a youngest child aged 14 years were employed. This compares to 70% and 55% in 1991 respectively.
The gap in employment rates between single and couple mothers in 2021 (Figure 13) was:
- 29% for mothers of 0-2 year olds (66% for couple mothers compared to 37% for single mothers)
- 21% for mothers of 3-5 year olds (75% for couple mothers compared to 54% for single mothers)
- 12% for mothers of 6-14 year olds (80% for couple mothers compared to 69% for single mothers)
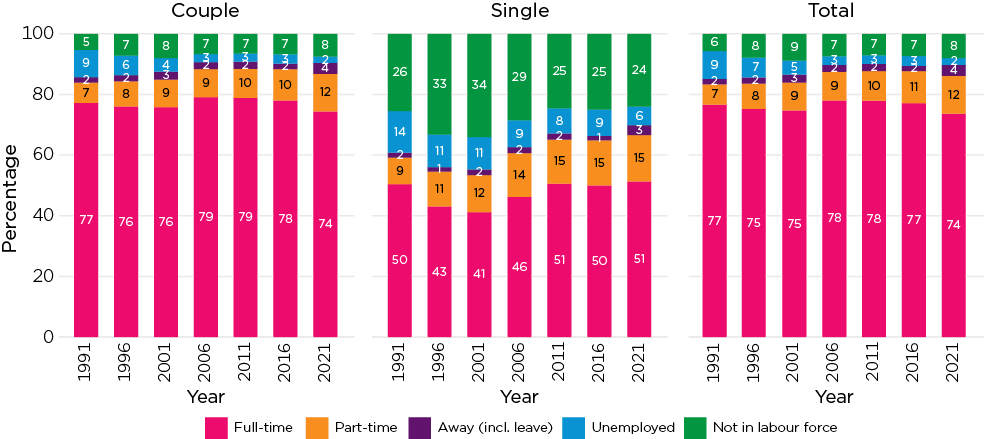
Figure 12: Employment for mothers continues to change over time and by age of youngest child.
Percentage employed, couple and single mothers by age of youngest child, 1991-2021
Note: Excludes mothers with labour force status not stated.
Source: ABS Census of Population and Housing custom data request, families with children aged less than 15 years.
Figure 13: The gap between single and couple mothers persists especially for mothers of 0-2 year olds.
Percentage of mothers employed, by relationship status and age of youngest child, 1991-2021
Note: Excludes mothers with labour force status not stated.
Source: ABS Census of Population and Housing custom data request, families with children aged less than 15 years.
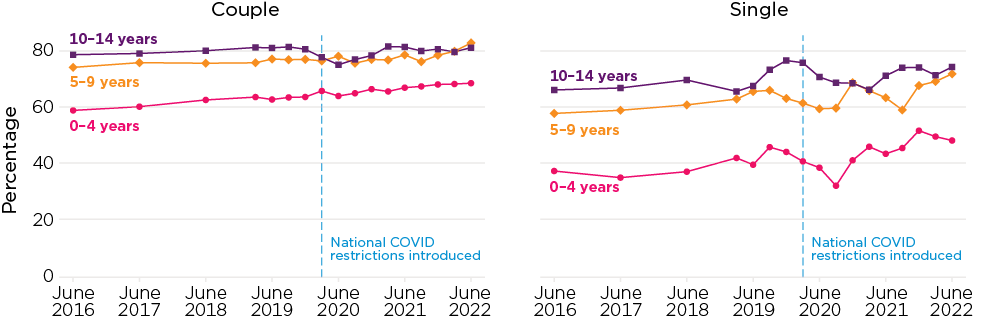
Extending the more detailed look at the period leading up to and over the COVID pandemic to incorporate age of youngest child, Figure 14 shows:
- Couple mothers' employment trend was disrupted for mothers with a youngest child aged 10-14 years around the time of restrictions in 2020, although the proportion employed rebounded to around previous levels in 2021 and 2022. Employment trends were relatively unaltered for couple mothers with younger children.
- For single mothers, for each age of youngest child group, there was a lot more variability in employment rates over the months up to and since the initial COVID-19 restrictions. However, for each, the average employment rate was higher at the end of this series than it was in 2019.
Figure 14: Single mothers experienced more variability in employment during the national COVID restrictions.
Percentage employed, couple and single mothers by age of youngest child, June 2016-June 2022
Source: ABS Labour Force Status of Families, data downloads, Table 7.
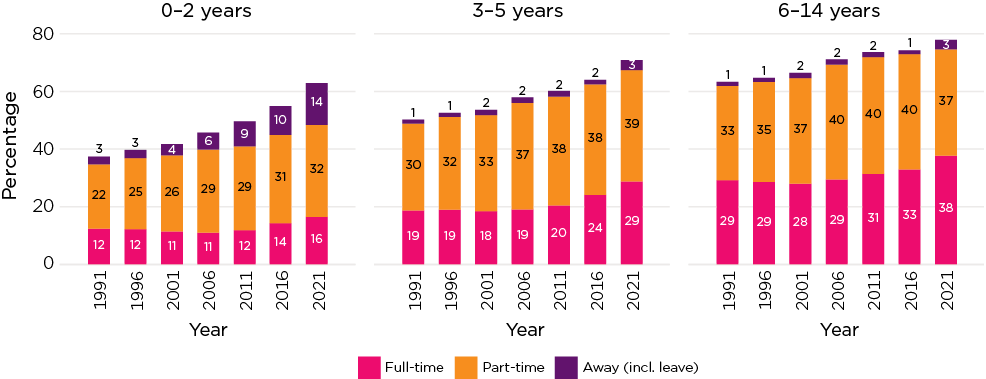
Work hours vary with children's ages
To explore the trends further, by age of youngest child, Figure 15 includes work hours. That is, employed mothers are classified according to whether they work zero hours, part-time hours or full-time hours.
- The zero hours group is likely to be largely those who are on leave from employment,8 and this proportion has increased significantly over the census years, especially for those with a child aged 0-2 years. (See also further analysis by single ages of children below.) This is an important trend, as it goes a long way to explaining the increased percentage of mothers with young children who are employed.
- Within the group of mothers of 0-2 year olds, the proportion working full-time hours has increased quite slowly, having remained at 11%-12% from 1991 to 2011 but increasing to 14% in 2016 and 16% in 2021.
- Very significant increases have been apparent in the proportion working part-time hours for this group, up from 22% in 1991 to 32% in 2021.
- For mothers of older children, there have also been increases in part-time work over these years. As for mothers of younger children, there was much more stability in the proportion working full-time. Recent census periods, however, have shown some considerable increases in full-time work.
- For mothers of 3-5 year olds, 20% worked full-time in 2011, which increased to 24% in 2016 and 29% in 2021.
- For mothers of 6-14 year olds, 31% worked full-time in 2011, 33% in 2016 and 37% in 2021.
Figure 15: Work hour trends vary for different ages of children.
Mothers' work hours by age group of youngest child, 1991-2021
Note: Excludes mothers with labour force status not stated or work hours not stated.
Source: ABS Census of Population and Housing custom data request, families with children aged less than 15 years.
Work hours and leave for mothers of younger children
Now looking at this more closely for the mothers of a youngest child aged under 3 years, Figure 16 shows work hours by age of the youngest child in single years.
- As noted above, the proportion working zero hours - employed but away from work - has increased considerably for those with a child aged under one year. This is very likely to reflect growth in the proportion of mothers remaining attached to employment through some form of parental leave (including the Australian Government's Parental Leave Pay). The growth in the proportion employed (almost doubling from 30% to 57% between 1991 and 2021) is entirely explained by this category.
- At 2021, one in three mothers were employed but away from work. This is higher than the one in four mothers in 2016 and the lower percentages in each of the previous census years.
- The findings for mothers of youngest children aged one or two years show the strong growth in part-time work for each group, a slight increase in the 'away from work' category, and more recent growth in full-time work.
The trends are especially interesting for the mothers of under-one-year-old children, and Figure 16 disaggregates this further by mothers' relationship status.9
The lower employment rate of single mothers has been seen previously (Figure 12). For both couple and single mothers with a child aged under one year, the increased employment rate largely reflects an increased proportion away from work, rather than working part-time or full-time. In 2021, as a proportion of employed mothers with a child aged under one year, 57% of couple mothers were away from work and 44% of single mothers were away from work.
Figure 16: The 'away from work' category is central to understanding employment trends for new mothers.
Mothers' work hours by age of youngest child under 3 years, 1991-2021

Note: Excludes mothers with labour force status not stated or work hours not stated.
Source: ABS Census of Population and Housing custom data request, families with children aged less than 3 years.
Figure 17: There has been strong growth in the numbers of couple mothers in the 'away from work' category for new mothers.
Couple and single mothers' work hours, mothers with under-one-year-old, 1991-2021
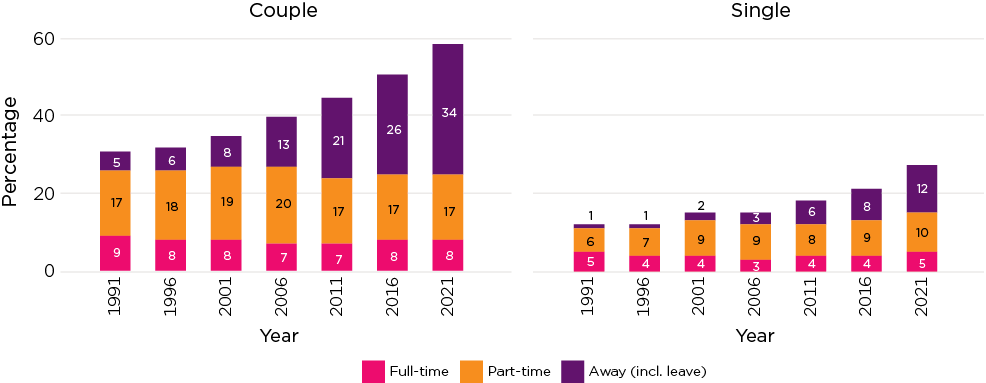
Note: Excludes mothers with labour force status not stated or work hours not stated.
Source: ABS Census of Population and Housing custom data request, families with children aged less than 1 year.
Fathers' employment
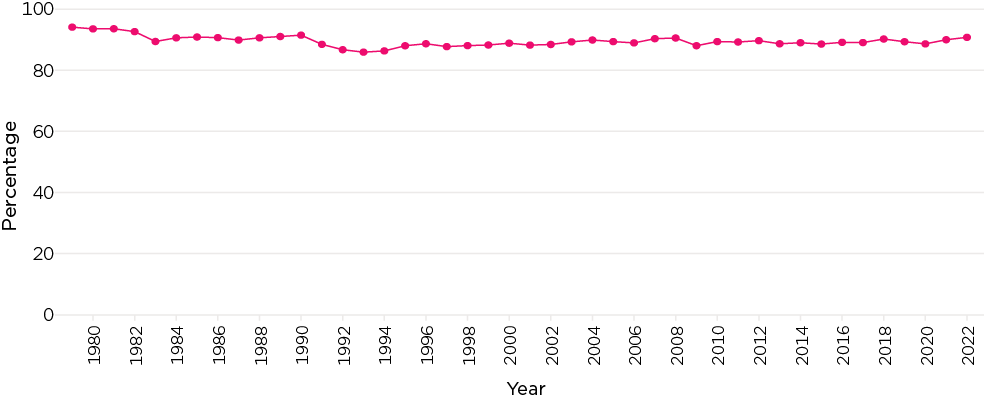
Most fathers with children under 15 years are employed, with 91% employed in 2022, slightly higher than in other recent years. This proportion has varied between 86% (the lowest being 85.9% in 1993) to 94% (the highest 94.1% in 1979) over the years shown in Figure 18.
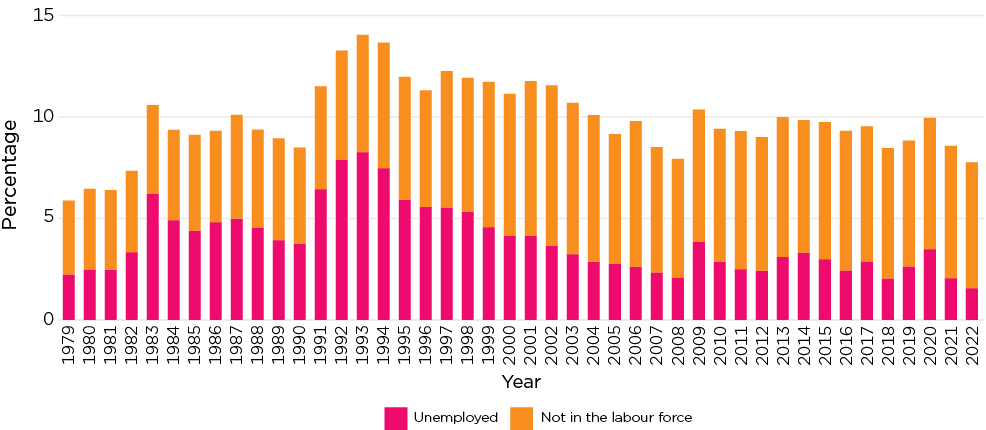
Fathers who are not employed comprise unemployed fathers and fathers not in the labour force. The proportion in each category has changed over this time period (Figure 19), with the majority not in the labour force in 2022. Around the times of economic downturns (such as in the mid 1980s and early 1990s) the proportion unemployed was considerably higher.
The census data are used to explore labour force participation for couple fathers and single fathers (Figure 20 shows the trends).
- Overall, single fathers are less likely to be employed than couple fathers, with it more likely they are not in the labour force rather than unemployed. The proportions unemployed and not in the labour force are higher for single fathers than couple fathers in all of the census years.
- Single fathers are more likely to be in part-time work compared to couple fathers, with only around half of the single fathers in full-time work in 2021 compared to 74% of couple fathers.
Figure 18: Most fathers are employed, with little change over time.
Percentage employed, fathers with children <15 years, 1979-2022
Source: ABS Labour Force Status of Families, data downloads, Table 3.
Figure 19: Not-employed fathers are now more likely to be not in the labour force rather than unemployed.
Labour force status of not-employed fathers with children <15 years, 1979-2022
Source: ABS Labour Force Status of Families, data downloads, Table 3.
Figure 20: There are marked differences between couple and single fathers with single fathers less often employed.
Couple and single fathers' labour force status, 1991-2021
Note: Excludes fathers with labour force status not stated or work hours not stated.
Source: ABS Census of Population and Housing custom data request, families with children aged less than 15 years.
Compared to the changes in employment for mothers, the changes for fathers are slighter, particularly couple fathers. For all fathers, there has been increased use of part-time work, with the proportion working part-time increasing from 6% in 1991 to 12% in 2021. To what extent this reflects underemployment (working fewer hours than preferred) rather than part-time work by choice needs further exploration to better understand the trends. In Employment over the life course, it was reported that in February 2022:
- Twenty-six per cent of male part-time workers and 18% of female part-time workers were underemployed; that is, they preferred to work more hours and were available to work more hours.
- Of the male underemployed part-time workers, 58% preferred to work full-time hours. For females, 41% preferred full-time hours.
Figure 21 presents couple and single fathers' employment participation by age of youngest child. While child's age is a key factor for mothers' employment, there is no apparent trend for couple fathers. The trend for single fathers by age of youngest child is not altogether linear, with employment rates at their lowest when the youngest child is around 1-3 years old. After this, there is generally a trend toward higher employment rates as children grow older. In 2021 this trend was not evident, with employment rates similar across ages 6-14 years.10
As with mothers, some differences between couple and single fathers in their employment participation are related to their different characteristics, such as educational attainment. In 2021, for example, 57% of single fathers and 73% of couple fathers completed year 12 or equivalent at school (derived from the Census data, Tablebuilder).
Figure 21: Couple fathers' employment rates do not vary by age of youngest child.
Couple and single fathers' employment rates, by age of youngest child, 1991-2021

Source: ABS Census of Population and Housing custom data request, families with children aged less than 15 years.
For couple fathers, work hours also change little by age of youngest child (Figure 22), with the only difference being for the fathers of under-one year olds, for which there is a slightly higher percentage away from work, likely reflecting some fathers taking parental leave. For single fathers, there is a trend toward more full-time work with increases in the age of the youngest child. The proportion in part-time work changes only a little across the children's ages.
Figure 22: Most fathers work full-time with differences by child age only apparent for single fathers.
Work hours of employed couple and single fathers, by age of youngest child (years), 2021

Source: ABS Census of Population and Housing custom data request, families with children aged less than 15 years.
Same-sex parents and employment
There is less data available for the analysis of same-sex parents' employment, with the relatively small number of such families typically resulting in unreliable statistics beyond the highly aggregated data in sample surveys. Using the census data, however, it is possible to compare male same-sex and female same-sex parental employment patterns to those of opposite-sex couple families. This can only be done for couple families with children aged under 15 years, rather than by age of youngest child as well.11 See Figure 23.
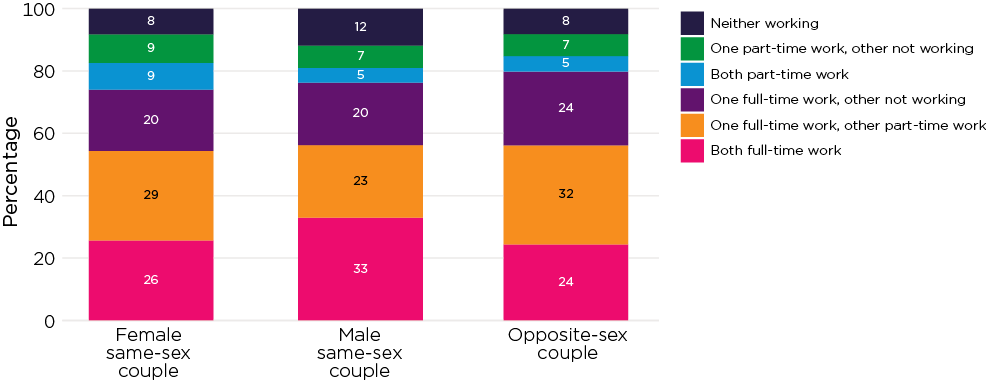
- The female same-sex couples and opposite-sex couples are similar in the proportions that have both partners employed and working full-time, at 26% and 24% respectively. The male same-sex couples are much more likely to be both working full-time (33%) than these other couple families.
- The opposite-sex couple families are the most likely to have one employed full-time and one employed part-time (32%). The next families most likely to have this arrangement are the same-sex female families (29%), with fewer having this employment arrangement within same-sex male families (23%).
- The opposite-sex couples are most likely to have the 'traditional' approach of one employed full-time and the other not employed/not working.
- The female same-sex couples are more likely than other couples to have both or only one working part-time.
- The proportion with both not employed/not working is higher in male same-sex couples compared to other couple families.
Some differences will relate to family characteristics such as age of youngest child (which is younger in the same-sex couple families) as well as differences in parental characteristics. See footnote 2 for some data on differences in age of youngest child. However, these data indicate a tendency within same-sex couple families for part-time work to be more commonly used by mothers (47% one or both worked part-time) than by fathers (35% one or both worked part-time), consistent with other parental employment analysis.
Figure 23: Some gendered employment patterns exist in same-sex couple families.
Parental employment patterns in same-sex and opposite-sex couples, 2021
Notes: Excludes those with either parent having labour force status not stated. 'Not working' includes those who are on leave (employed and working zero hours).
Source: ABS Census of Population and Housing, Tablebuilder, families at place of enumeration, couple families with children aged less than 15 years.
Summary
This detailed look at family employment trends shows the very significant changes that have come about over recent decades, with the changes largely reflecting growth in maternal employment. There has been very little change for fathers over this period.
The increased use of part-time work has been especially marked, although growth in full-time work is also apparent, especially in more recent years. Part-time work is very often used by mothers, although fathers' use of part-time work has increased over the years. Understanding to what extent fathers and mothers who are working part-time would prefer full-time work will be an important direction in further research.
Further, the analysis for mothers of children under one year old highlights there have been significant increases in the use of parental leave at this time, as indicated by mothers being employed but working zero hours. This shows that mothers are much more likely now to remain employed when they have a new child rather than to leave the labour market altogether. The reasons for this will require further examination but this has been supported by the increased availability of employer-provided parental leave (Workplace Gender Equality Agency, 2022) and the Australian Government's Parental Leave Pay. The proportion of new mothers employed and at work (working more than zero hours) has changed little over the years examined. The proportion of fathers of babies working zero hours is much smaller than for mothers, reflecting their lower use of parental leave at this time compared to mothers. Changing patterns of work by age of youngest child persist for mothers but fathers' work patterns are largely unchanged by age of youngest child.
This research report has set out to describe patterns and trends, rather than exploring the range of socio-economic or demographic factors that explain differences in employment. Contextual factors, such as access to child care, have also not been considered in this research. Clearly, the expansion of child care over past decades and changes to child care subsidies have intended to better support families to engage in employment (Bray et al., 2021). More research is planned, which will look further into these employment trends for families. The different employment patterns of single parents compared to couple parents are especially relevant in considering the socio-economic status of different families. Further work exploring the barriers for single-parent families and how single parents' connection to employment may be improved is important.
The key takeaway message is that gendered parental employment patterns remain very marked, and there is an ongoing need to explore to what extent this reflects preferences or whether they are experienced negatively within the family and the workplace. These gendered patterns have ongoing consequences for women's lifetime earnings and superannuation.
Bibliography
Australian Bureau of Statistics. (various years). Labour Force Status of Families. Canberra: ABS.
Australian Bureau of Statistics. (various years). Census of Population and Housing. Canberra: ABS.
Baxter, J. (2013a). Employment and the life course: Analyses of birth cohort differences of young Australian women. In A. Evans, & J. H. Baxter (Eds.) Negotiating the life course: Stability and change in life pathways (pp. 99-120). Springer, Netherlands.
Baxter, J. (2013b). Employment characteristics and transitions of mothers in the Longitudinal Study of Australian Children. (Occasional Paper No. 50). Canberra: Department of Social Services.
Baxter, J. (2013c). Parents working out work (Australian Family Trends No. 1). Melbourne: Australian Institute of Family Studies.
Baxter, J. (2015). Gender role attitudes within couples, and parents' time in paid work, child care and housework. In Australian Institute of Family Studies. (Ed.) The Longitudinal Study of Australian Children Annual Statistical Report 2014 (pp. 39-62). Melbourne: AIFS.
Baxter, J. (2018). Stay-at-home fathers in Australia (Research Report). Melbourne: Australian Institute of Family Studies.
Baxter, J. (2019). Fathers and work: A statistical overview (Research summary). Melbourne: Australian Institute of Family Studies.
Baxter, J., & Renda, J. (2011). Lone and couple mothers in the Australian labour market: Differences in employment transitions. Australian Journal of Labour Economics, 14(2), 103-22.
Baxter, J., & Warren, D. (2020). Towards COVID normal: Employment & work-family balance. Families in Australia Survey report. Melbourne: Australian Institute of Family Studies.
Bray, J. R., Baxter, J., Hand, K., Gray, M., Carroll, M., Webster, R. et al. (2021). Child Care Package Evaluation: Final Report (Research Report). Melbourne: Australian Institute of Family Studies.
van Egmond, M., Baxter, J. H., Buchler, S., & Western, M. (2010). A stalled revolution? Gender role attitudes in Australia, 1986- 2005. Journal of Population Research, 27(3), 147-168.
Warren, D., Qu, L., & Baxter, J. (2020). Families Then & Now: How we worked. (Research Report). Melbourne: Australian Institute of Family Studies.
Workplace Gender Equality Agency (WGEA). (2022). Australia's Gender Equality Scorecard: Key results from the Workplace Gender Equality Agency's Employer Census 2021-22. Bella Vista, NSW: WGEA. Retrieved from www.wgea.gov.au/sites/default/files/documents/WGEA-Gender-Equality-Scorecard-2022.pdf
1 This uses the ABS series Labour Force Status of Families, June 2022.
2 There are differences in the ages of children within these different family forms. For example, using the 2021 Census (in Tablebuilder), with opposite-sex couple families 33% have a youngest child aged 0-4 years, 34% have a youngest 5-9 years and 32% have a youngest 10-14 years. Same-sex couple families are a little more likely to have younger children: for female same-sex couples, 40% have a youngest child aged 0-4 years, 32% have a youngest 5-9 years and 28% 10-14 years. For male same-sex couples, 36% have a youngest child aged 0-4 years, 35% have a youngest 5-9 years and 28% the youngest is 10-14 years. In single-parent families, 23% have a youngest child 0-4 years, 35% a youngest 5-9 years and 42% a youngest 10-14 years. Disaggregation of the single parent data by gender of single parent was not possible from this data source.
3 AIFS uses a customised data table provided by the ABS, in which parental labour force details are disaggregated by age of youngest child and relationship status. These data are available for 1991 through to 2021. The 2016 and 2021 data exclude same-sex couple families, as same-sex couples could not be accommodated in the table specification.
4 The ABS classifies people as employed full-time if they worked, or usually work, a total of 35 or more hours in the survey reference week. Part-time workers are those who worked and usually work less than 35 hours in the survey reference week. Labour Force Explained.
5 Derived from Labour Force Status of Families, 2021, TableBuilder
6 The broad patterns by grouped age of youngest child reflect the averages of employment patterns by age of youngest child in single years.
7 Some previous AIFS work on this includes Employment characteristics and transitions of mothers in the Longitudinal Study of Australian Children, Lone and couple mothers in the Australian labour market, and Australian mothers' participation in employment.
8 It will also include those who have employment with hours that vary from week to week, and who had no hours of work in the reference week.
9 In the 2021 Census, derived from Tablebuilder, 10% of under one year olds, 12% of one year olds and 13% of two year olds lived in a one parent family.
10 We note that while these analyses use census data, there may be some 'noise' in the single father data, as very young children in separated families are more often living with a single mother than a single father. For example, aggregation of the 2021 census data found about 2,200 single fathers and 24,400 single mothers with a child aged under one year old. Numbers are higher for older children, for example, according to aggregated census data, there were 7,200 single fathers and 28,500 single mothers with a youngest child aged 14 years.
11 More detailed analysis will be possible with the Confidentialised Unit Record files from the census, or custom data requests drawing on the census data.
Acknowledgements
Author: Jennifer Baxter
Editor: Katharine Day
Graphic design: Lisa Carroll
Featured image: © GettyImages/Big Joe
Suggested citation
Baxter, J. (2023). Employment patterns and trends for families with children. (Research Report). Melbourne: Australian Institute of Family Studies.
978-1-76016-273-3
18 May 2023
