Births in Australia
Facts and Figures 2023
April 2023

Number of births and fertility rate
According to the Australian Bureau of Statistics (ABS), there were 309,996 new births registered in 2021. This represented a recovery from the 2020 figure of 294,369. The total fertility rate, a measure that gives the average number of children an Australian woman would have during her lifetime should she experience the age-specific fertility rates present at the time was 1.7 births per woman in 2021. This was up from the 1.59 for 2020, the lowest total fertility rate ever reported. The 2021 total fertility rate remains well below the most recent peak of 2.02 births per woman in 2008.
Historical fertility trends
Figure 1 shows the changes in the number of births and total fertility rate since 1921. The total fertility rate fell in the 1920s and early 1930s. After reaching a trough of 2.11 births per woman in 1934, during the Great Depression, it rose until the early 1960s. The highest total fertility rate since 1921 was 3.55 in 1961, after which it mostly fell in the following two decades. The total fertility rate fell sharply after the contraceptive pill became available in 1961 and stabilised in the late 1960s. It had another steep decline after the pill was placed on the Pharmaceutical Benefits Scheme list in 1972. After stabilising in the 1980s, the total fertility rate fell in small progressive steps in the 1990s.
Following a rise around the beginning of the millennium, the fertility rate reached 2.02 births per woman by 2008. It has been trending down since then. As noted above, there was a sharp decrease reported for 2020 but the 2021 statistics indicated a recovery in these numbers.
Since 1976, Australia's total fertility rate has been below replacement level (about 2.1 births per woman). Replacement level is the level at which a population is replaced from one generation to the next without immigration.
Figure 1: Number of births and total fertility rate, 1921–2021
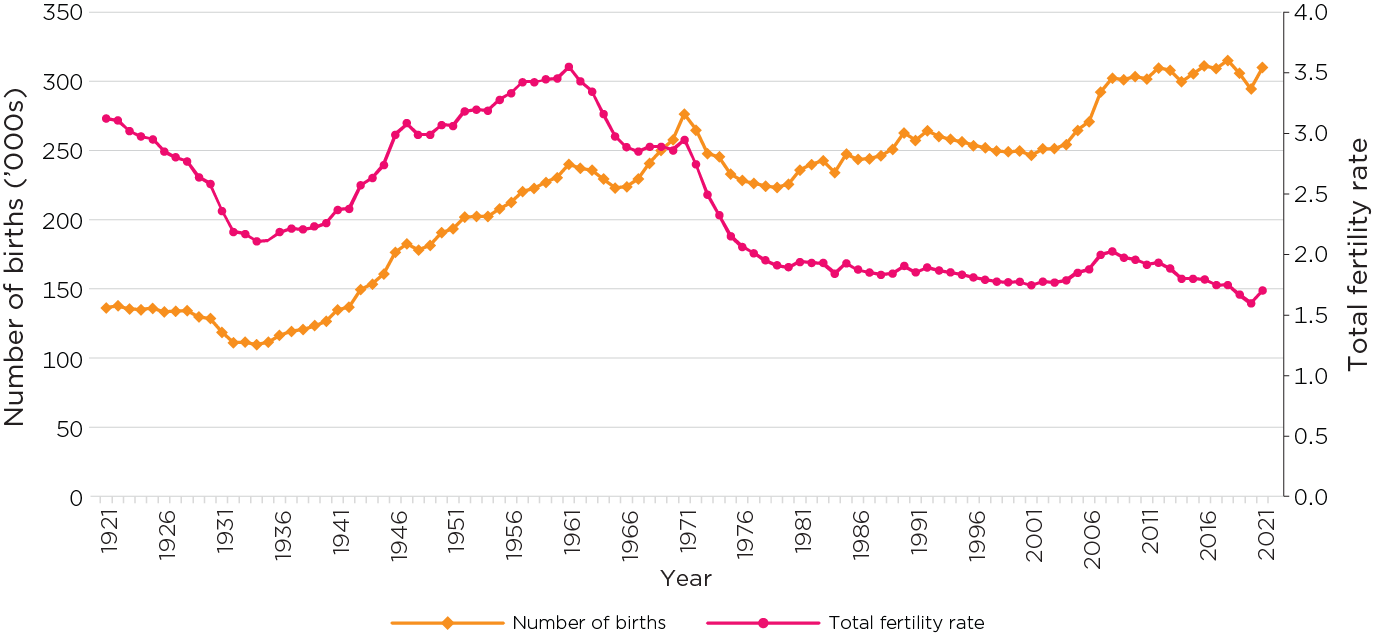
Note: Total fertility rate is the average number of children a woman would have during her lifetime should she experience the age-specific fertility rates present at the time.
Sources: ABS (2014, 2021a & b).
The total fertility rate varies across states and territories, as shown in Figure 2. Compared to the national level, the fertility rates in the Northern Territory, Queensland, New South Wales and Western Australian were higher, while the other states and territory had relatively low fertility rates. In 2021 the total fertility rate was highest in the Northern Territory (1.82 births per woman). The total fertility rate was relatively low in Victoria (1.53) but was lowest in the ACT (1.45). These variations by jurisdiction are largely consistent with those reported in earlier years (see Figure 2).
Figure 2: Total fertility rate by state/territory, 2020 and 2021
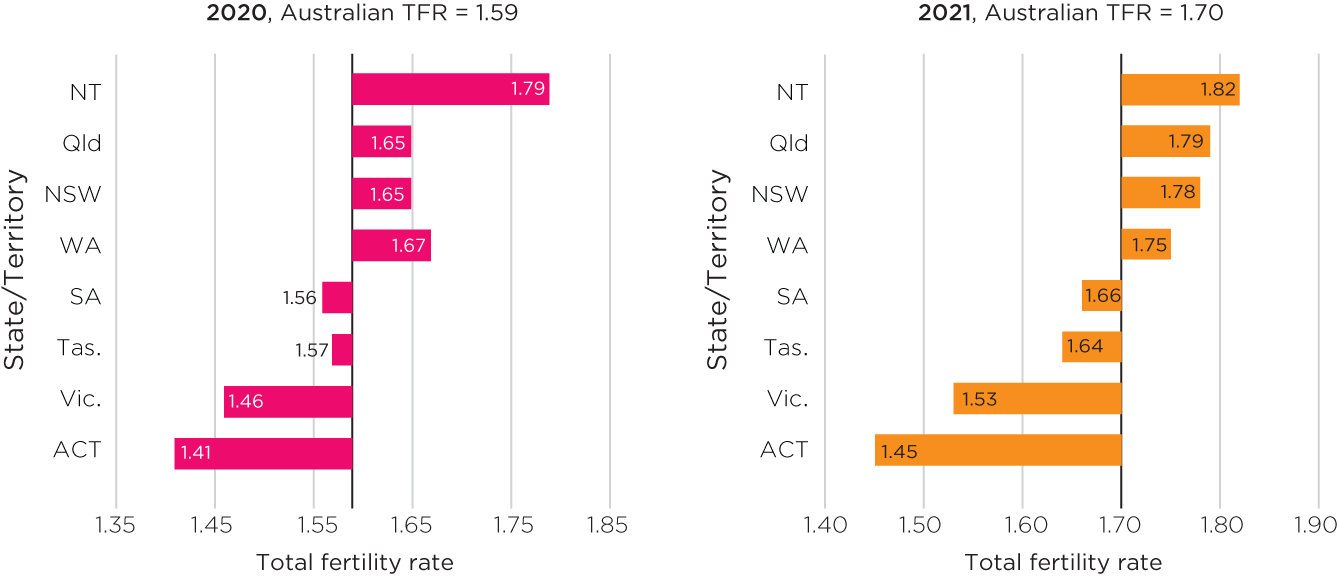
Note: TFR = Total fertility rate.
Sources: ABS (2021b)
Age-specific fertility rate
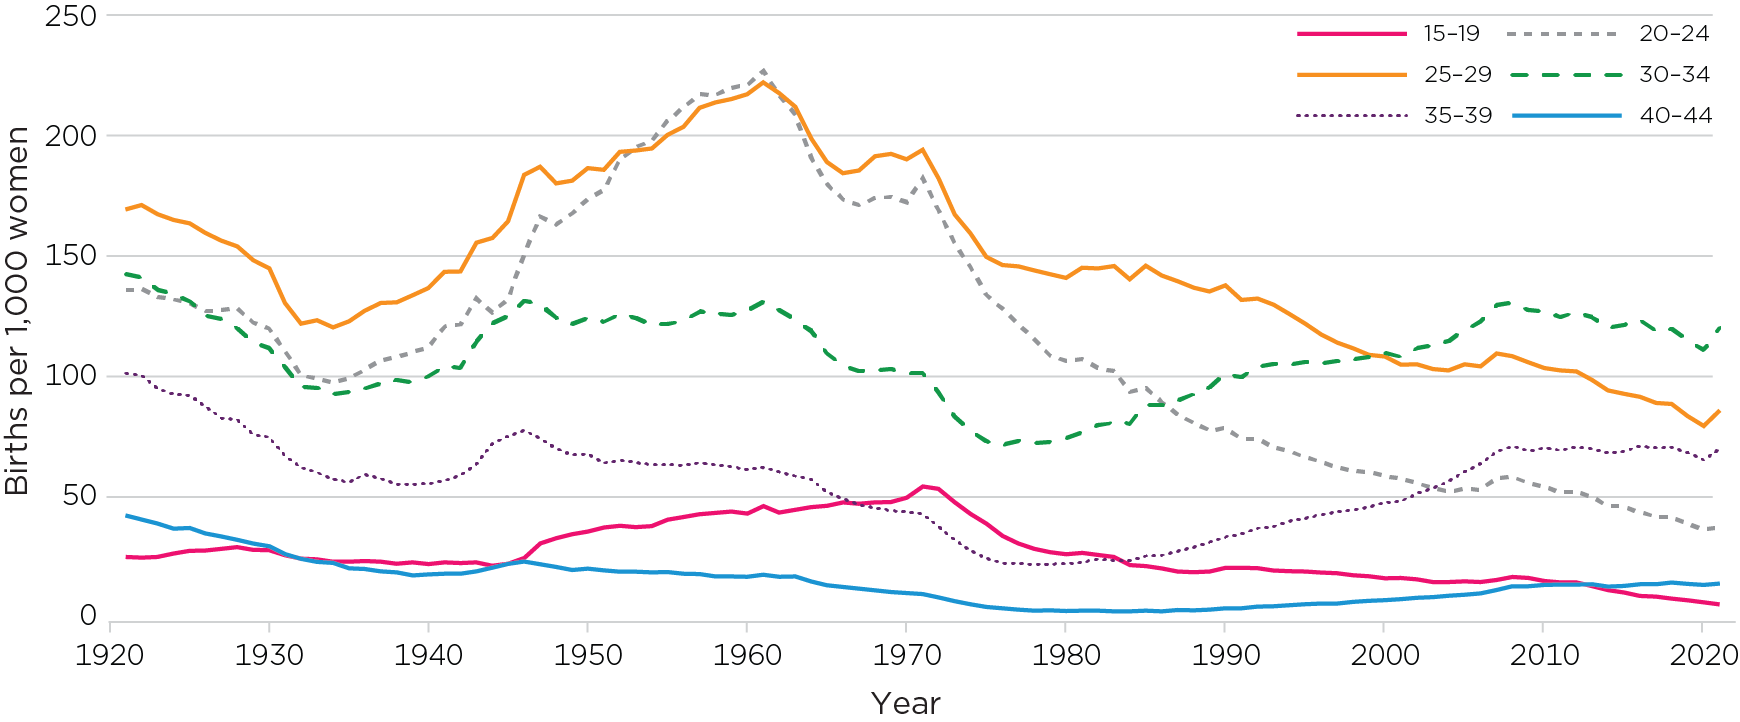
The trends in fertility vary considerably when examined for different age groups. This is typically explored using age-specific fertility rates. This measure is the number of births to women within a particular age group, per 1,000 women in that age group. Figure 3 presents trends in age-specific fertility rates, starting in 1921.
Historical trends
- Similar to the general trend in the total fertility rate described above, the age-specific fertility rates fell in the 1920s and early 1930s and rose in the 1940s.
- The fertility rates for women in their twenties (20–24 years and 25–29 years) continued to rise in the 1950s. The decline in the age of first marriage (see Marriages) and the steep rise in fertility among women aged 20–24 and 25–29 years who were married contributed to the rising fertility rate during the period from the late 1940s to the early 1960s. In fact, the ‘baby boom’ after the second World War was mainly a ‘marriage boom’ as fertility rates within marriage changed little (Ruzicka & Caldwell, 1982).
- From the 1950s to the mid-1970s, the fertility rates of women aged 20–24 and 25–29 were markedly higher than that of all other groups.
- While the age-specific fertility rates were increasing for women in their twenties during the 1950s, they were stable for women aged 30–34 years and showed a downward trend for those aged 35–39 years. That is, women were starting their families at a younger age, which may have led to them achieving their desired family size when relatively young, rather than continuing to have more children through their late thirties.
- The impacts of the contraceptive pill on fertility, noted in the section above, were apparent in all age groups but especially so for women aged in their twenties. There were rapid declines in fertility after 1961 and again after 1972 when the pill was added to the Pharmaceutical Benefits Scheme, especially for women aged 20–24 and 25–29 years.
- The fertility rates of those aged in their thirties have mostly increased since the early 1980s, while the fertility rates for women in their twenties has continued to fall. This reflects the trend of women delaying having a first child (see below on age of first-time mothers).
- Since 2000, the fertility rate of women in their early thirties has been higher than all other groups. However, the fertility rate for women aged 30−34 has been trending down over the last decade while the fertility rate for women aged 35−39 has remained stable since 2008.
- The teenage fertility rate rose during the 1960s, which was consistent with the pattern of decline in age at first marriage (see the fact sheet on Marriages).1 However, the rate declined from the early 1970s, with the pill becoming more readily available and affordable. The fall in the fertility rates for those in their teens and twenties has also been influenced by social changes such as increased participation in formal schooling and tertiary education by young people (with the change for young women especially relevant), women’s increased labour force participation, and changes in family-related values and attitudes (for discussions see Jain & McDonald, 1997; Weston, Qu, Parker, & Alexander, 2004).
Figure 3: Age-specific fertility rates, 1921–2021
Source: ABS (2014, 2021b)
Age of first-time mothers
Statistics on the age of first-time mothers come from data collected on births, referring to the age at which a woman gave birth to her first child. The statistics on the age of first-time mothers are shown in Figure 4 for selected years. These patterns reflect the trends in the age-specific fertility rates described above.
These data are sourced from the Australian Institute of Health and Welfare (AIHW) and most recent data included here refer to births in 2020.
Historically, data on the age of first-time mothers excluded mothers who gave birth outside marriage, with ex-nuptial births having previously been much less common than in recent years (see Figure 6). The data in Figure 4 for 1961, 1971 and 1981, therefore, refer to the births to married women.
- In 1961 and 1971, nearly half of first-time mothers were aged 20–24 years. Nearly 6 in 10 first-time mothers were under 25 years. The pattern of women starting a family in their early twenties or younger would be even more pronounced had ex-nuptial births been included, given that mothers who gave birth outside marriage were likely younger (see Figure 9 for patterns of nuptiality by age).
- In 1981 and 1991, women most commonly had their first child in their twenties, with the proportions of first-time mothers aged 25–29 years being higher compared to 1961 and 1971 (36%–37% vs 21%–25%).
- The proportion of first-time mothers aged 20–24 years declined sharply from 49% in 1961 to 28% in 1991. By 2020, it was 14%. Similarly, the proportion of first-time mothers who were teenagers declined from 17% in 1961 and 18% in 1971 to 4% in 2020.
- The percentage of women having their first child at or over 30 years of age rose from up to 15% before 1981, to 23% in 1991, and 43% in 2011. By 2020, one-half of first-time mothers (53%) was aged 30 years or over. The proportion of first-time mothers who were aged 35 years and older increased markedly in this time. Before 1991, it was uncommon for women to start childbearing at age 35 years or older (up to 5%). By 2020, 17% of first-time mothers were aged 35 years or older.
Figure 4: Age of first-time mothers, selected years, 1961–2020
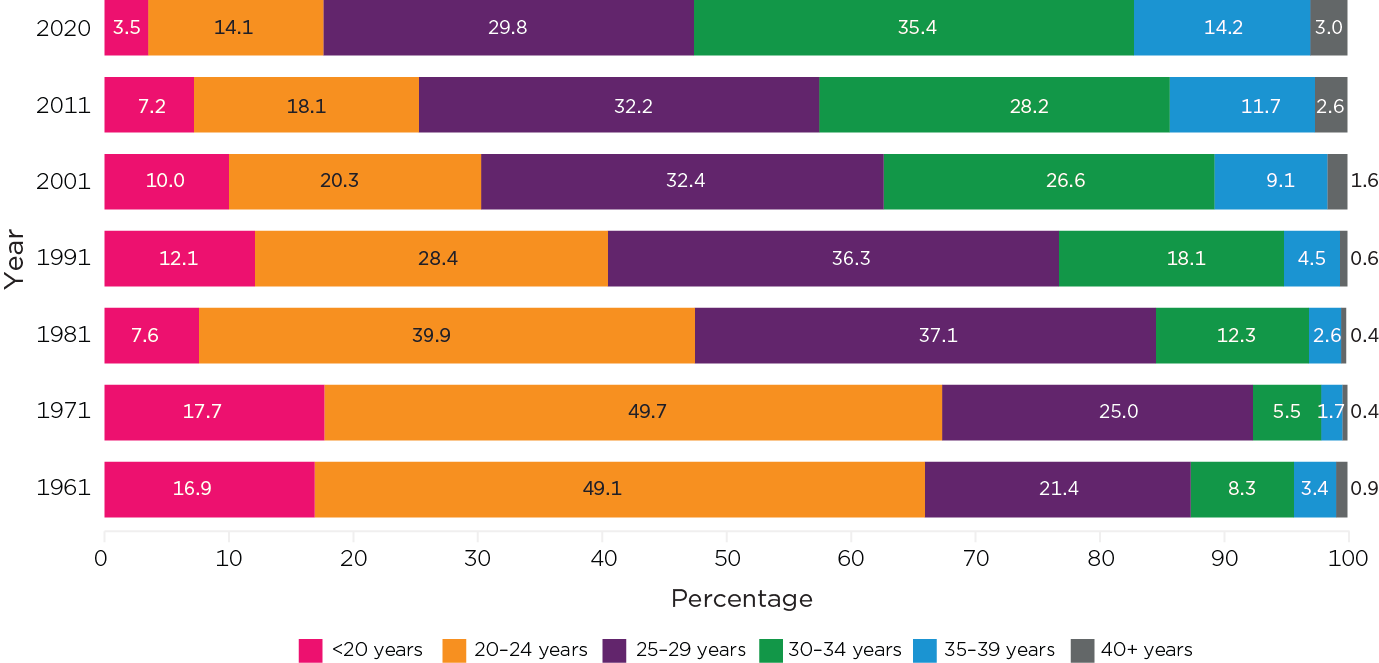
Note: The data for 1961, 1971 and 1981 excluded mothers who first gave birth outside marriage.
Sources: ABS (1963, 1973); AIHW (2022); Lancaster, Huang, & Pedisich (1994); Laws & Sullivan (2004); Li, Zeki, Hilder, & Sullivan (2013)
The trends in age distributions of first-time mothers in recent years have continued gradually, with no marked aberration in 2020, the first year of the COVID-19 pandemic (Figure 5). In recent years, from 2016, women have been more likely to have their first child in their early thirties than in their late twenties. Despite the gradual upward trend in age at first birth, a significant proportion of women still have a first birth in their late twenties, with the number only declining from 36% in 1991 to 30% in 2020.
Figure 5: Age of first-time mothers, 2015–20

Source: AIHW (various years)

Births outside marriage and paternity acknowledgement
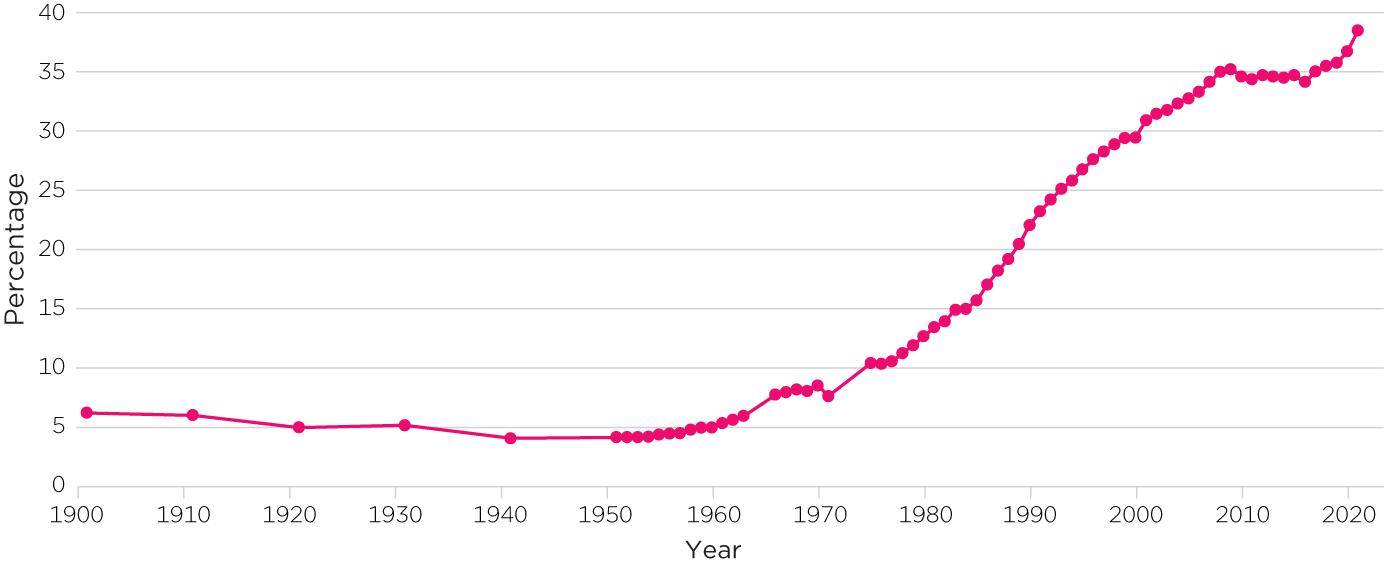
For the first half of the twentieth century, around 4%–6% of all births occurred outside marriage, rising to 8% in the late 1960s (Figure 6).2 Consistent with the rise in cohabitation (see Families then and now: Couple relationships), the portion of births outside of marriage has increased considerably since the 1970s:
- In 1971, only 7% of births were ex-nuptial, compared to 38% in 2021.
- The rate of births outside marriage stayed relatively steady between about 2008 and 2017, sitting at just over a third of all births.
- From 2017 there has been a trend upwards, so that by 2021, 38% of births occurred outside marriage.
Research by Qu & Weston (2012) shows that the majority of ex-nuptial births are to cohabiting couples rather than single mothers. See also Marriages, for related data on the trends in marriage.
Figure 6: Ex-nuptial births as a proportion of all births, 1901–2021
Sources: ABS (2021c); Commonwealth Bureau of Census and Statistics (1964, 1973)
In recent data, most births outside marriage have paternity acknowledged, which means the biological father’s name as well as the mother’s name appears on the application for a birth certificate. The percentage that is paternity acknowledged among ex-nuptial births has fluctuated between 88% and 91% over the last two decades. In 2021, 90% of births outside marriage were paternity acknowledged.
Figure 7 shows that the proportion of births outside marriage was highest in the Northern Territory (60% in 2021) and lowest in the ACT (29%). The rate of paternity acknowledgements among births outside of marriage was highest in Victoria (95% in 2021) and lowest in the Northern Territory (73% in 2021).3
Figure 7: Ex-nuptial births by state/territory, 2021

Source: ABS (2021a)
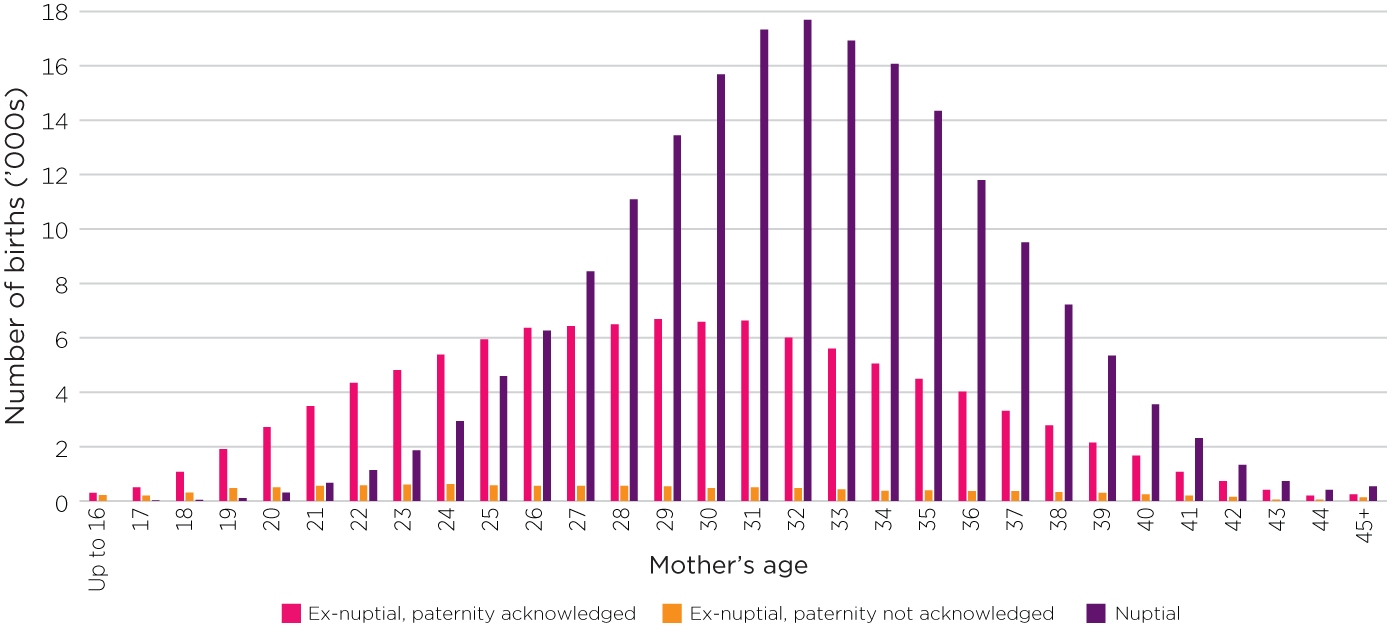
There are some differences by age of the mother in both the incidence of having a birth outside of marriage and of paternity acknowledgement (Figures 8 and 9). The distribution of mothers’ ages is quite different according to whether or not births are within marriage (Figure 8). Ex-nuptial births are more common than nuptial births for mothers under the age of 25 years.
Figure 8: Number of births by nuptial/paternity acknowledgement status and age of mothers, 2021
Sources: ABS (2021c)
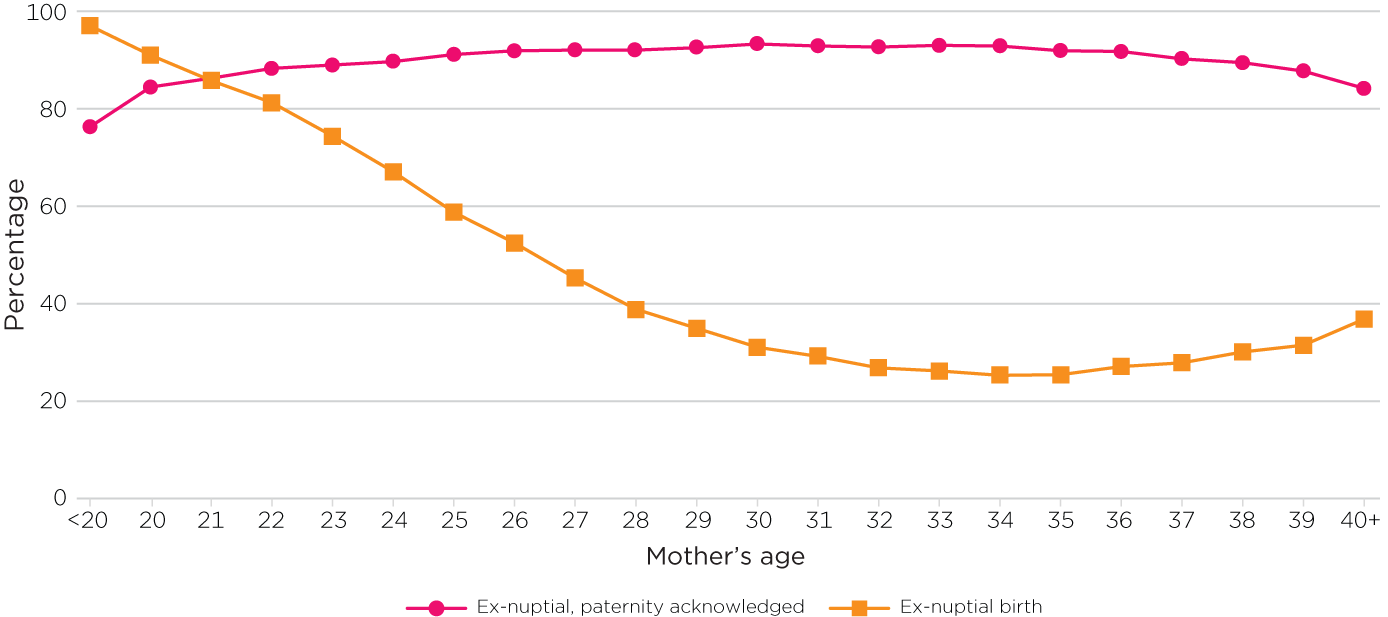
Figure 9 shows clearly the age-related differences at each age between the proportion of births that are nuptial and that are ex-nuptial; and of those that are ex-nuptial, the proportion in which paternity is acknowledged.4 Paternity acknowledgement was high at all ages, even for the youngest mothers, although it increased by age for mothers up to about 25 years. After 25, to about 37 years, the proportion of paternity acknowledged births (among ex-nuptial births) remained stable at just over 90%. At older ages, the proportion was somewhat lower, dropping to 84% for mothers aged 40 years or older.
Figure 9: Proportion of births outside marriage and proportion of ex-nuptial births with paternity acknowledgement by age of mothers, 2021
Source: ABS (2021c)
Completed fertility at age 45–49 years
The fertility data presented above focuses on births at different points in time to derive different rates of fertility. Another perspective on fertility is gained by looking at how many children women have ever had at different ages. Trends in the number of children that 45–49 year old women have ever had provides insights into trends in complete fertility, given most women have completed their childbearing by these ages.
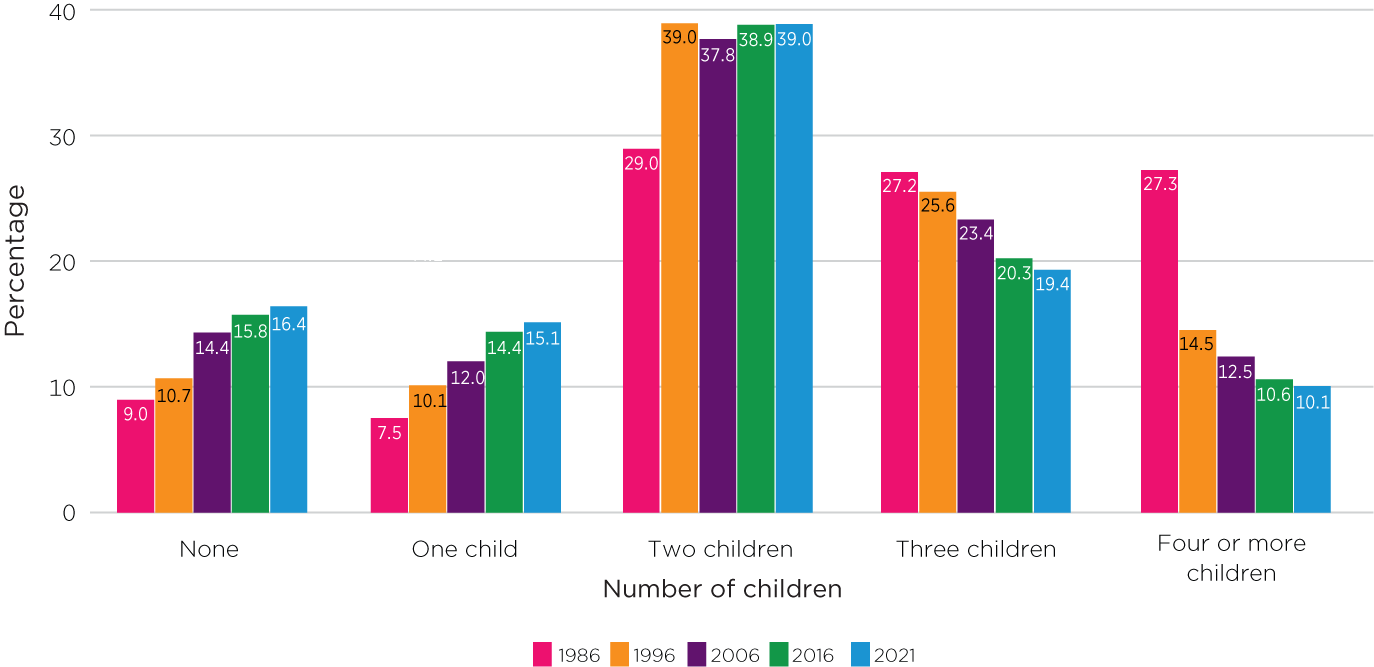
There is a lag evident when comparing the completed fertility of 45–49 year old women at a point in time to when peak childbearing was likely to occur for those women. For example, women aged 45–49 in 1981 were 25–29 in 1961 (at which time they likely already had one or two children according to the fertility data). In comparison, women aged 45–49 in 2016 were 25–29 in 1996. In 1996 the fertility rate for 25–29 year olds was around half of the peak in 1961 and, at this time, the average age at first birth was rising rapidly. Figure 10 shows that, by age 45–49 years, the proportion of women who have had three or more children has fallen considerably since the 1980s, which is consistent with the changes in fertility patterns.
These trend data are shown for selected years back to 1986. Note, the ‘children ever born’ question is not asked every census.
- The proportion of 45–49 year olds who have had no children or only one child has continued to increase in each of the periods shown. At 2021, 31% of 45–49 year olds had no children ever born or had one child.
- In 1986, women aged 45–49 years were equally likely to have had two children, three children and four or more children (27%–29%). In the years to follow, there was a dramatic decline in the proportion having four or more children (down to 15% in 1996 and more recently, in 2021, to 10%). There has also been a steady decline in the proportion with three children (from 27% in 1986 down to 19% in 2021).
- The decline in the prevalence of larger families in the 1996 data was balanced by an increase in the proportion of families with two children (up to 39%); and the proportion with two children has remained the same over these census periods. This is the most common family size.
Figure 10: Completed fertility (number of children had ever had), women aged 45–49, 1986–2021
Sources: ABS (1989–2022), Census of Population and Housing 1986–2021
Fertility of subpopulations
Indigenous status
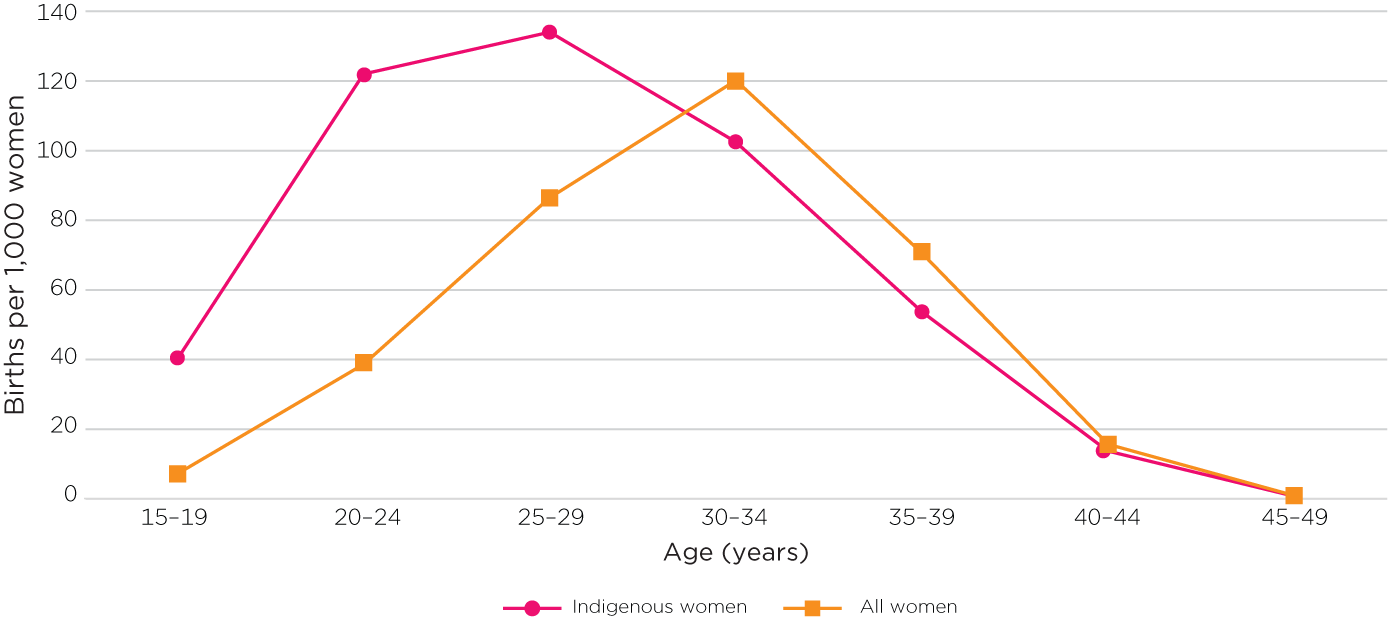
In 2021, the fertility rate of Indigenous women was 2.3 births per woman, compared to 1.7 for women in Australia overall. The higher fertility rates for Indigenous women were especially apparent for women aged under 30 years, with the gap being particularly marked for those aged 20–24 years (Figure 11). In comparison, the fertility rates for Indigenous women in their 30s were slightly lower than those of all women of the same ages.
Figure 11: Age-specific fertility rate of Indigenous women and all women, 2021
Source: ABS (2021d)
Country of birth
To derive reliable statistics based on mothers’ country of birth, the ABS averages fertility data over three years rather than using one year’s data. These analyses find that the total fertility rate for overseas-born women is marginally lower than for Australian-born women (1.592 vs 1.655 births per woman, based on the three-year average to the end of 2021).
There is more variation when rates for individual countries of birth are examined. Figure 12 shows the total fertility rates for women of the 11 most common countries of birth outside Australia among those of reproductive age in 2019–21.
- Women from New Zealand had the highest fertility rate of these 11 countries of birth, at 2.1 births per woman.
- This was followed by women born in the United Kingdom (1.8) and women who were born in India, Vietnam or South Africa (1.57–1.66).
- Of the 11 countries of birth outside Australia, women from Korea and China had the lowest fertility rates (1.05 and 1.08 births per woman respectively).
Figure 12: Total fertility rate for the most common countries of birth, 2021

Notes: The most common 11 countries are identified as those with the largest female resident population aged 15–49 years. The ABS reports total fertility rates that are averaged using data for the three years ending in 2021.
Source: ABS (2021d)
Remoteness
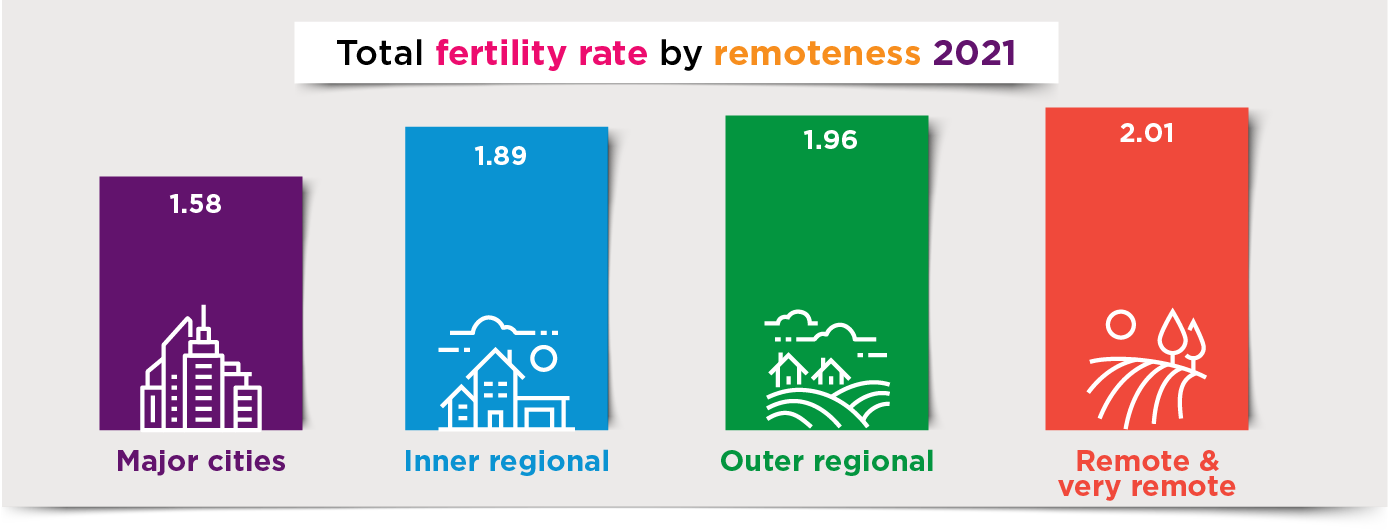
The total fertility rate also differs by levels of remoteness of regions of residence. The rate is lowest in major cities (1.58 births per woman) and highest in remote and very remote areas (2.01). The fertility rate was 1.89 for inner regional areas and 1.96 for outer regional areas.
Source: ABS (2021d)
Fertility and assisted reproductive technology
The trends in fertility described in this report are clearly in the direction of women delaying childbearing to later ages. With this delay comes a heightened risk of having difficulty conceiving, such that families are unable to achieve their desired family size.5
Access to assisted reproductive technologies (ART) is enabling many people to overcome their infertility or other barriers to having children.
Assisted reproductive technology refers to 'treatments or procedures that involve the in vitro handling of human oocytes (eggs) and sperm or embryos for the purposes of establishing a pregnancy'. ART does not include artificial insemination. (Newman, Paul & Chambers, 2021, p. 76).
Rapid advances in the technology since its introduction around 1980, as well as the changing fertility patterns, have seen its uptake and use increase. Data on rates of use are published each year by the National Perinatal Epidemiology and Statistics Unit (NPESU).
Figure 13 shows that the proportion of women giving birth as the result of ART increased from less than 2% in 2001 to 4% in 2010. In 2022 the proportion was 5%. The year-to-year changes may be affected by data limitations, outlined in the figure notes, but the overall trend is clear.
Figure 13: Women giving birth through ART as a percentage of all women giving birth, Australia, 2001–20
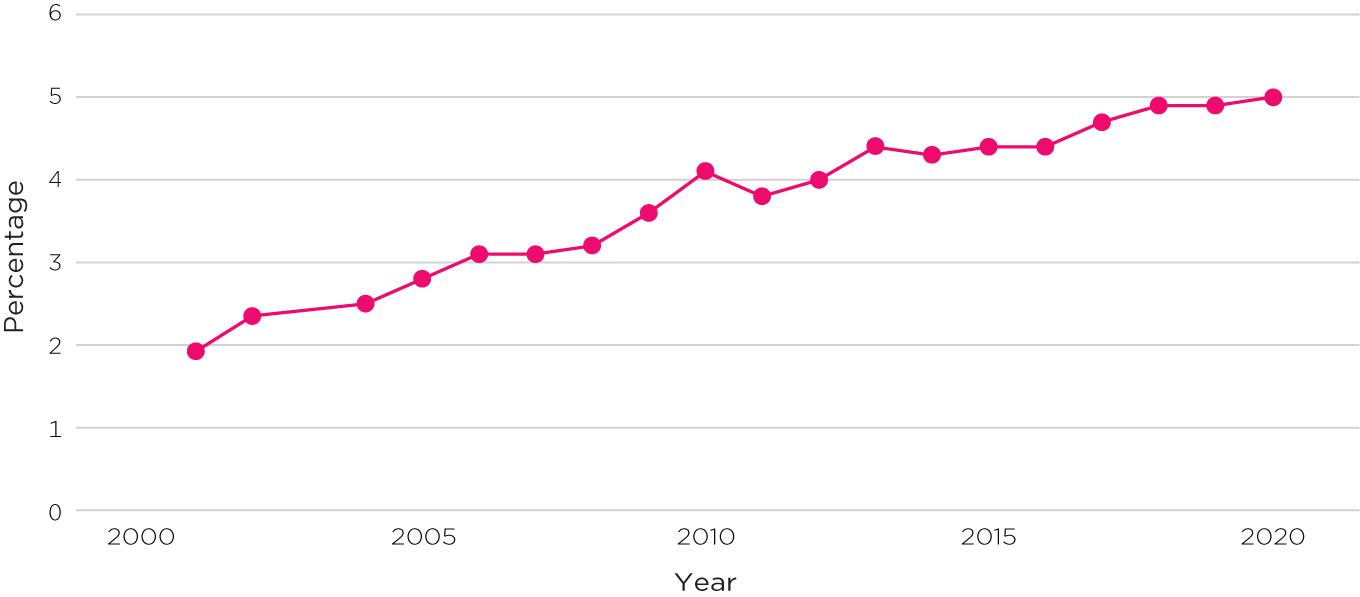
Notes: For 2001 and 2002, the percentage was computed using the number of women giving birth as result of ART in the year as a proportion of all women who gave birth in the same year (Laws & Sullivan, 2004a & 2004b). For 2007 onward, data were based on a subset of jurisdictions: Victoria, Queensland, Tasmania and ACT for 2007 and 2013–20; Victoria, Queensland, Western Australia, Tasmania and ACT for 2008, 2011 and 2012; Queensland, Western Australia; Tasmania, ACT for 2009 and 2010.
Sources: NPESU data 2002–19 (see full list in references)
Another measure is to what extent women are making use of ART, focusing more on the treatment itself. Measures of ART treatments are commonly used.
Each ART treatment involves a number of stages and is generally referred to as an ART treatment cycle. The embryos transferred to a woman can either originate from the cycle in which they were created (fresh cycle) or be frozen (cryopreserved) and thawed before transfer (thaw cycle). (Newman, Paul, & Chambers, 2021, p. vi)
In 2019, women who sought treatment had 1.8 treatment cycles on average. These data were based on women who used their own oocytes (egg cells) or embryos, and such treatment cycles accounted for 95% of all treatment cycles in 2019 (i.e. including other treatment cycles such as donor oocytes or embryos, surrogacy cycles).
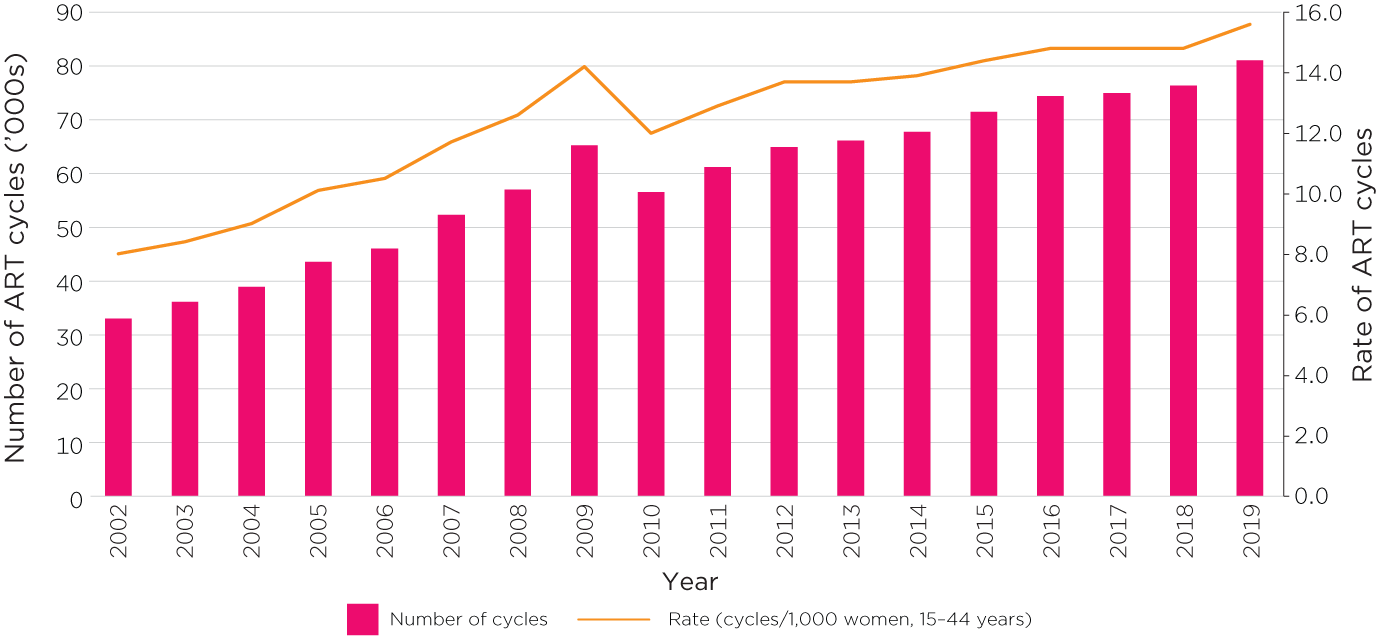
Figure 14 presents the numbers of ART treatment cycles in Australia and the number per 1,000 women in their reproductive age (15–44 years) from 2002 to 2019. The use of ART has risen markedly, with the number of treatment cycles in 2019 nearly two and half times the number in 2002.
Figure 14: Number of ART treatment cycles and rate of ART cycles in Australia, 2002–19
Data sources: NPESU data 2002–19
Figure 15 breaks down ART treatment cycles by type of treatments:
- ‘freeze-only cycles’ are treatments that only involve freezing embryos or eggs for future use
- ‘fresh non-freeze cycles’ are treatments that do not use embryos or eggs that have been frozen (i.e. excluding ‘freeze-only cycles’)
- ‘thaw cycles’ are treatments that use previously frozen embryos.
The first two categories combined are referred to as ‘all fresh cycles’ (i.e. not using previously frozen embryos).
The data refer to the number of treatments undertaken since 2007 (or 2010 for some series) in Australia and New Zealand, with 90%–93% of treatment cycles being undertaken in Australia across the years. They indicate:
- a significant rise in the use of freeze-only treatments, with the numbers increasing from around 1,610 in 2010 to 15,079 in 2019
- an increase in treatments involving thawing preserved embryos
- lower numbers of fresh no-freeze treatment cycles in recent years, compared to peaks in 2011 and 2012.
Figure 15: Number of ART treatment cycles by whether fresh or thaw treatment cycles, Australia and New Zealand, 2007–19

Notes: ART treatment cycles include autologous treatment cycles and other treatment cycles. A freeze only cycle refers to a fresh treatment cycle (autologous) in which all oocytes or embryos are frozen for future use. Fresh non-freeze cycles were all fresh cycles minus autologous freeze only cycles. Thaw cycles include autologous thaw cycles and other thaw cycles (e.g. oocyte/embryo recipient cycles, surrogacy cycles, etc.).
Sources: Newman, Paul, & Chambers (2021); Harris, Fitzgerald, Paul, Macaldowie, Lee & Chambers (2016); Macaldowie, Wang, Chambers, & Sullivan (2012)
A useful measure of the outcomes from ART treatments is the number of live births per 100 treatment cycles undertaken in a period. Figure 16 plots this rate for 2019 by the age of women at the start of a treatment cycle for fresh non-freeze cycles and thaw cycles (Newman, Paul, & Chambers, 2021), and for the two types of treatment cycles combined.
- The live birth rate for all treatment cycles was 22%, with the rate being higher for thaw cycles than fresh cycles (29% vs 17%).
- The live birth rate declines with women’s age, with the rate for all treatment cycles falling from 31% for the age group under 30 years, to 23% for the age group 35–39 years, and 3% for the oldest age group (45+ years).
- This age-related decline applied to both types of ART treatment but the decline in the live birth rate was steeper for the fresh non-freeze cycles than the thaw cycles.
Figure 16: Live births as a percentage of treatment cycles,a Australia and New Zealand, 2019

Note:a The live births were based on ‘autologous’ treatment cycles; that is, treatment cycles ‘in which a woman intends to use, or uses, her own oocytes or embryos’ (Newman, Paul, & Chambers, 2021, p. 76). Freeze-only treatment cycles (i.e. freezing eggs or embryos for future use) were excluded.
Data sources: Newman, Paul, & Chambers (2021). The live births rates for two types of cycles were derived based on the source data.
References
- Australian Bureau of Statistics (ABS). (various years). Births, Australia (Catalogue No. 3301.0). Canberra: ABS.
- Australian Bureau of Statistics. (1963). Australian Yearbook (Catalogue No. 1301.0).
- Australian Bureau of Statistics. (1973). Australian Yearbook (Catalogue No. 1301.0).
- Australian Bureau of Statistics. (1989). Census of population and housing, 30 June 1986: Cross-classified characteristics of persons and dwellings Australia (Catalogue No. 2498.0). Canberra: ABS.
- Australian Bureau of Statistics. (2014). Australian historical statistics – Births (Catalogue. No. 3105.0.65.001).
- Australian Bureau of Statistics. (2022). 2021 Census of Population and Housing – General community profile G28: Number of children ever born. Canberra: ABS.
- Australian Bureau of Statistics. (2021a). Births, summary, by state [Data Explorer], accessed 26 October 2022.
- Australian Bureau of Statistics. (2021b). Fertility, by age, by state [Data Explorer], accessed 26 October 2022.
- Australian Bureau of Statistics. (2021c). Births, by nuptiality, by age of mother [Data Explorer], accessed 26 October 2022.
- Australian Bureau of Statistics. (2021d). Births, Australia (Catalogue No. 3301.0). Canberra: ABS.
- Australian Institute of Health and Welfare (AIHW). (2021). Australia's mothers and babies 2019 – data tables (Table 1.2). Canberra: AIHW. Retrieved from www.aihw.gov.au/reports/mothers-babies/australias-mothers-babies/data
- Australian Institute of Health and Welfare (AIHW). (2022). Supplementary tables for Australia's mothers and babies 2020 – in brief. Canberra: AIHW.
- AIHW (various years). Supplementary tables for Australia's mothers and babies (2015–2022) – in brief. Canberra: AIHW.
- Commonwealth Bureau of Census and Statistics. (1964). Demography (Bulletin No. 63). Canberra: ABS.
- Commonwealth Bureau of Census and Statistics. (1973). Demography (Bulletin No. 86). Canberra: ABS.
- Harris, K., Fitzgerald, O., Paul, R. C., Macaldowie, A., Lee, E., & Chambers, G. M. (2016). Assisted reproductive technology in Australia and New Zealand 2014. Sydney: National Perinatal Epidemiology and Statistics Unit, the University of New South Wales.
- Hilder, L., Zhichao, Z., Parker, M., Jahan, S., & Chambers, G.M. (2014). Australia’s mothers and babies 2012 (Perinatal statistics series no. 30). Canberra: AIHW National Perinatal Epidemiology and Statistics Unit.
- Jain, S. K., & McDonald, P. F. (1997). Fertility of Australian birth cohorts: Components and differentials. Journal of the Australian Population Association, 14(1), 31–46.
- Lancaster, P., Huang, J., & Pedisich, E. (1994). Australia’s mothers and babies 1991 (Perinatal statistics series no.1). Canberra: Australian Institute of Health and Welfare.
- Laws, P. J., & Sullivan, E. A. (2004a). Australia’s mothers and babies 2001 (Perinatal statistics series no. 13). Sydney: AIHW National Perinatal Statistics Unit.
- Laws, P. J., & Sullivan, E. A. (2004b). Australia’s mothers and babies 2002 (Perinatal statistics series no. 15). Sydney: AIHW National Perinatal Statistics Unit.
- Laws, P. J. & Sullivan, E. A. (2005). Australia’s mothers and babies 2003 (Perinatal Statistics Series No. 16). Sydney: AIHW National Perinatal Statistics Unit.
- Laws, P. J., Grayson, N. & Sullivan, E.A. (2006). Australia’s mothers and babies 2004 (Perinatal statistics series no. 18). Sydney: AIHW National Perinatal Statistics Unit.
- Laws, P. J., Abeywardana, S., Walker, J, & Sullivan, E.A. (2007). Australia's mothers and babies 2005 (Perinatal statistics series no. 20). Sydney: AIHW National Perinatal Statistics Unit.
- Laws, P. J., & Hilder, L. (2008). Australia’s mothers and babies 2006 (Perinatal statistics series no. 22). Sydney: AIHW National Perinatal Statistics Unit.
- Laws, P., & Sullivan, E. A. (2009). Australia’s mothers and babies 2007 (Perinatal statistics series no. 23). Sydney: AIHW National Perinatal Statistics Unit.
- Laws, P.J., Li, Z., & Sullivan, E. A. (2010). Australia’s mothers and babies 2008 (Perinatal statistics series no. 24). Canberra: AIHW.
- Li, Z., McNally, L., Hilder, L., & Sullivan, E. A. (2011). Australia’s mothers and babies 2009 (Perinatal statistics series no. 25). Sydney: AIHW National Perinatal Epidemiology and Statistics Unit.
- Li, Z., Zeki, R., Hilder, L., & Sullivan, E. A. (2012). Australia’s mothers and babies 2010 (Perinatal statistics series no. 27) Canberra: AIHW National Perinatal Epidemiology and Statistics Unit.
- Li, Z., Zeki, R., Hilder, L., & Sullivan, E. A. (2013). Australia’s mothers and babies 2011 (Perinatal statistics series no. 28). Canberra: AIHW National Perinatal Epidemiology and Statistics Unit.
- McDonald, P. (1995). Families in Australia: A socio-demographic perspective. Melbourne: Australian Institute of Family Studies.
- Macaldowie, A., Wang, Y. A., Chambers, G. M., & Sullivan, E. A. (2012). Assisted reproductive technology in Australia and New Zealand 2010 (Assisted reproduction technology series no. 16. Cat. no. PER 55). Canberra: AIHW.
- Newman, J. E., Paul, R. C., & Chambers, G. M. (2021). Assisted reproductive technology in Australia and New Zealand 2019. Sydney: National Perinatal Epidemiology and Statistics Unit, the University of New South Wales.
- Qu, L., & Weston, R. (2012). Parental social marital status and children’s wellbeing (Occasional Paper no. 46). Canberra: Australian Department of Social Services.
- Ruzicka, L. T. & Caldwell, J. C. (1982). Fertility. In Economic and Social Commission for Australia and the Pacific, Country Monographic Series no. 9, Population of Australia, vol. 1 (pp. 199–229). New York, NY: United Nations.
- Weston, R., Qu, L., Parker, R., & Alexander, M. (2004). ‘It’s not for lack of wanting kids’: A report on the Fertility Decision Making Project (Research Report no. 11). Melbourne: Australian Institute of Family Studies.
References for NPSU data
- Bryant, J., Sullivan, E., & Dean J. (2004). Assisted reproductive technology in Australia and New Zealand 2002 (AIHW Cat. No. PER 26). Sydney: Australian Institute of Health and Welfare (AIHW) National Perinatal Statistics Unit (Assisted Reproductive Technology Series No. 8).
- Fitzgerald, O., Harris, K., Paul, R. C., & Chambers, G. M. (2017). Assisted reproductive technology in Australia and New Zealand 2015. Sydney: National Perinatal Epidemiology and Statistics Unit, the University of New South Wales.
- Fitzgerald, O., Paul, R. C., Harris, K., & Chambers, G. M. (2018). Assisted reproductive technology in Australia and New Zealand 2016. Sydney: National Perinatal Epidemiology and Statistics Unit, the University of New South Wales.
- Harris, K., Fitzgerald, O., Paul, R. C., Macaldowie, A., Lee, E., & Chambers, G. M. (2016). Assisted reproductive technology in Australia and New Zealand 2014. Sydney: National Perinatal Epidemiology and Statistics Unit, the University of New South Wales.
- Macaldowie, A., Lee, E., & Chambers, G. M. (2015). Assisted reproductive technology in Australia and New Zealand 2013. Sydney: National Perinatal Epidemiology and Statistics Unit, the University of New South Wales.
- Macaldowie, A., Wang, Y. A., Chambers, G. M., & Sullivan, E. A. (2012). Assisted reproductive technology in Australia and New Zealand 2010 (Assisted Reproduction Technology Series No. 16. Cat. No. PER 55). Canberra: AIHW National Perinatal Statistics Unit.
- Macaldowie, A., Wang, Y. A., Chambers, G. M., & Sullivan, E. A. (2013). Assisted reproductive technology in Australia and New Zealand 2011. Sydney: National Perinatal Epidemiology and Statistics Unit, the University of New South Wales.
- Macaldowie, A., Wang, Y. A., Chughtai, A. A., & Chambers, G. M. (2014). Assisted reproductive technology in Australia and New Zealand 2012. Sydney: National Perinatal Epidemiology and Statistics Unit, the University of New South Wales.
- Newman, J. E., Fitzgerald, O., Paul, R. C., & Chambers, G. M. (2019). Assisted reproductive technology in Australia and New Zealand 2017. Sydney: National Perinatal Epidemiology and Statistics Unit, the University of New South Wales.
- Newman, J. E., Paul, R. C., & Chambers, G. M. (2020). Assisted reproductive technology in Australia and New Zealand 2018. Sydney: National Perinatal Epidemiology and Statistics Unit, the University of New South Wales.
- Newman, J. E., Paul, R. C., & Chambers, G. M. (2021). Assisted reproductive technology in Australia and New Zealand 2019. Sydney: National Perinatal Epidemiology and Statistics Unit, the University of New South Wales.
- Wang, Y. A., Chambers, G. M., Dieng, M., & Sullivan, E. A. (2009). Assisted reproductive technology in Australia and New Zealand 2007 (Assisted Reproduction Technology Series No. 13. Cat. No. PER 47). Canberra: AIHW National Perinatal Statistics Unit.
- Wang, Y. A., Chambers, G. M., & Sullivan, E. A. (2010). Assisted reproductive technology in Australia and New Zealand 2008 (Assisted Reproduction Technology Series No. 14. Cat. No. PER 49). Canberra: AIHW National Perinatal Statistics Unit.
- Wang, Y. A., Dean, J. H., Badgery-Parker, T., & Sullivan, E. A. (2008). Assisted reproduction technology in Australia and New Zealand 2006 (Assisted Reproduction Technology Series No. 12. AIHW Cat. No. PER 43). Sydney: AIHW National Perinatal Statistics Unit.
- Wang, Y. A., Dean, J. H., Grayson, N., & Sullivan, E. A. (2006). Assisted reproduction technology in Australia and New Zealand 2004 (Assisted Reproduction Technology Series No. 10. Cat. No. PER 39). Sydney: AIHW National Perinatal Statistics Unit.
- Wang, Y. A., Dean, J. H., & Sullivan, E. A. (2007). Assisted reproduction technology in Australia and New Zealand 2005 (Assisted Reproduction Technology Series No. 11. Cat. No. PER 36). Sydney: AIHW National Perinatal Statistics Unit.
- Wang, Y. A., Macaldowie, A., Hayward, I., Chambers, G. M., & Sullivan, E. A. (2011). Assisted reproductive technology in Australia and New Zealand 2009 (Assisted Reproduction Technology Series No. 15. Cat. No. PER 51). Canberra: AIHW National Perinatal Statistics Unit.
- Waters, A.-M., Dean, J. H., & Sullivan, E. A. (2006). Assisted reproduction technology in Australia and New Zealand 2003 (Assisted Reproduction Technology Series No. 9. Cat. No. PER 31). Sydney: AIHW National Perinatal Statistics Unit.
1 McDonald (1995) noted that about one-quarter of brides were pregnant at the time of marriage. There was this tension between the desire to be sexually active and the social stigma associated with premarital sex in the 1950s and 1960s.
2 These data are derived from birth registrations. There are differences across jurisdictions and over time in the way parents other than birth parents (e.g. for same-sex parents) can be acknowledged on the birth certificates. This section uses the data as provided by the ABS, which reports births as being nuptial (within marriage), ex-nuptial (paternity acknowledged; that is, the father is named on the birth certificate), or ex-nuptial (paternity not acknowledged).
3 The high level of ex-nuptial births in NT relates to the relatively high proportion of births in NT that are Indigenous (i.e. registered as Aboriginal or Torres Strait Islander births, with either father or mother being Aboriginal or Torres Strait Islander). Ex-nuptial births are more common among Indigenous births than non-Indigenous births. Births data for 2014 indicated that 36% of births in NT were Aboriginal and Torres Strait Islander, compared to up to 9% in other states and territory (Births in Australia 2014 released by ABS in 2015). In 2014, the proportion of Indigenous births that were born outside marriage was 84%, while it was 34% for all births. Equivalent data have not been published in subsequent years.
4 Lack of paternity acknowledgement can indicate an unwanted pregnancy or inability to establish paternity, although some women may intend to conceive, to be a ‘single mother by choice’. See for example The Single Mother by Choice Myth (sagepub.com).
5 It should be noted that men’s fertility also decreases as they age. Only 13% of births registered in 2021 were to fathers aged 40–49 years and 1% were to fathers aged 50 years and older.
Related publications

Marriages in Australia
Figures around marriages in Australia: marriage rate, age at first marriage, religious and civil weddings, and more.
Read more
Divorces in Australia
The latest figures around divorces in Australia: divorce rate, duration of marriage at divorce, and the extent to which…
Read more
Employment of men and women across the life course
This Facts and Figures summarises information about employment participation, with a focus on gender and age…
Read more