The two-way relationship between socio-economic status and health conditions for Australian men
Ten to Men Insights #3 Report: Chapter 3
Key messages
The relationship between a person's economic and social circumstances and their health has been recognised for decades. However, most existing evidence comes from cross-sectional studies, offering limited insights into whether, and which, socio-economic indicators lead to health changes - or vice versa.
Using a longitudinal study design, this report shows a two-way relationship between key contemporary economic and social indicators and the development of physical and mental health conditions over a 9-year period.
Specifically, in a representative sample of over 4,000 Australian men aged 18-55 years without any pre-existing health conditions we found:
- Of the long-term physical health conditions examined, the most common new diagnoses were for high blood pressure followed by long-COVID.
- Of the mental health conditions examined, the most common new diagnosis was for depression.
- Rates of new diagnoses of multiple long-term health conditions were higher for men with disabilities and men who were overweight.
Financial stress and discrimination increased the risk of multiple long-term health conditions.
- Men with disabilities, men who speak a language other than English at home and men born in non-English-speaking countries experienced higher rates of both financial stress and discrimination compared to their counterparts.
Having strong social support and greater job control protected against the risk of developing mental health conditions, while having disability increased this risk.
- Men with disabilities experienced lower levels of both social support and job control compared to their counterparts.
When examining these relationships from the other direction, in a representative sample of over 13,000 Australian men, we found a strong association between earlier mental health conditions and the development of socio-economic disadvantage.
- Men diagnosed with 3 or more long-term physical health conditions had a 70% higher risk of experiencing financial stress compared to men who had never been diagnosed with these conditions.
- Non-heterosexual men, men who speak a language other than English at home, men born in non-English-speaking countries and men with disabilities experienced higher rates of unfair treatment compared to their counterparts.
Research and policy implications
Physical and mental long-term health conditions not only result from socio-economic disadvantage but contribute to it, highlighting the need for integrated health and social policies that address both the causes and consequences of poor health. This includes cross-sectoral collaboration between health, employment and social services and tailored interventions to address the specific needs of priority populations. Our findings support a broader approach to investigating systemic inequalities beyond traditional socio-economic indicators, given the direct, bidirectional link between these indicators and the rapid development of new health conditions in Australian men.
Overview
Health equity means that everyone has a fair and just opportunity to be healthy (Gómez et al., 2021). Conversely, health inequities are avoidable differences in health outcomes between population groups that are influenced by social, economic and environmental factors (Hassan et al., 2024). Globally, health inequity tends to be higher, on average, for men than women (Fourie, 2019). This is also the case in Australia, where a number of health outcomes remain poorer among men (Timonin et al., 2025), especially among those from key priority groups (The Lancet Public Health, 2023).
The current health status of Australians
The average number of years lived in full health remains lower for men than for women, with little change over time (Australian Institute of Family Studies [AIHW], 2023). Data from the Australian Bureau of Statistics (ABS) indicate that 83% of women and 80% of men reported a current medical condition that has or is expected to last for 6 months or more (ABS, 2022a). However, while the prevalence of medical conditions is higher for women, the burden of disease, that is the impact of living with illness and injury, is higher for men. In 2024, men experienced 1.2 times the rate of total burden of women, with 1.6 times the rate of fatal burden (AIHW, 2024a).
Long-term health conditions, both physical and mental, are a particular concern due to their links to disability and premature death (AIHW, 2024a). Multiple long-term health conditions, that is the co-occurrence of 2 or more health conditions, remains one of the most pressing public health challenges of our time (Boast, 2018; Mossadeghi et al., 2023). Overall, 1 in 3 Australians live with multiple long-term health conditions, although estimates vary depending on the number and type of conditions included in analysis, as well as the source of data used (AIHW, 2024b).
With respect to mental health, more than 4 in 10 Australians have experienced a mental condition at some time in their life, and 1 in 5 had a 12-month mental health condition in 2020-22, with prevalence lower for men than women (ABS, 2023). This may partly reflect the fact that men are less likely than women to access mental health services (ABS, 2021a; Cronin et al., 2021; Otten et al., 2021).
The relationship between socio-economic status and health
Previous international research over several decades around the social determinants of health has established the connection between a range of socio-economic status (SES) indicators, such as education, employment and income, and a range of health outcomes (Ahnquist et al., 2012). People from lower SES groups generally have poorer health outcomes - with improvements in SES indicators often leading to a corresponding improvement in overall health (Barakat & Konstantinidis, 2023; Blázquez et al., 2014). In fact, a person's economic and social position plays a more crucial role in health, both directly and indirectly, than individual behaviours (Bialowolski et al., 2021; Kivimäki et al., 2020).
In Australia, a similar collection of SES indicators has been closely linked to health inequities across the population (AIHW, 2024c). Previous research has demonstrated that priority population groups, such as Aboriginal and/or Torres Strait Islander peoples, people with disabilities, culturally and linguistically diverse communities and those living in rural or low-income settings experience lower SES indicators at disproportionately high levels, and often in combination, further exacerbating existing health disparities (AIHW, 2024c; National Indigenous Australians Agency, 2025; National Rural Health Alliance, 2024).
Contemporary approaches to understanding and addressing socio-economic disadvantage and health inequities among men
With the association between traditional SES indicators and health well-established, recent studies have focused on an expanded view of both SES and health inequity. Social connection or inclusion is increasingly being studied as a key determinant of health outcomes. In studies published in 2020-24, lower social inclusion has been identified as a concern for younger and older men and has been demonstrated to increase the risk of poorer mental health outcomes (Emmer et al., 2024), long-term health conditions (Priest et al., 2020) and overall health inequity (World Health Organization [WHO], 2025).
Similarly, social exclusion, through experiences of discrimination and unfair treatment, which are disproportionately reported by priority population groups (Williams et al., 1997), has been linked to a range of poorer health outcomes (Adonteng-Kissi et al., 2025; Liamputtong & Rice, 2021). Further, emerging concerns around employment conditions, such as poor job quality, excessive workloads and low job control, have also been linked to a rise in mental health and long-term health conditions (Wang et al., 2021).
Evidence around social determinants highlights that health inequities and outcomes can also drive socio-economic trajectories. For instance, mental health and long-term health conditions can directly impact the SES of individuals and families by affecting productivity, financial wellbeing and overall societal progress (Galobardes et al., 2006; Meurillon et al., 2025; WHO, n.d.; Zhu et al., 2024). Those with health conditions can experience high medical expenses, reduced work capacity and the need for ongoing care (Cutler, 2022; Guan et al., 2022). This has become a key area of focus for policy makers and researchers working towards reducing social inequities.
Despite this, much of the existing evidence around socio-economic disadvantage and health comes from cross-sectional studies, with limited research available to show whether socio-economic disadvantage leads to poor health or vice versa. While some longitudinal studies (Kendig et al., 2016; Kivimäki et al., 2020; Williams et al., 2013) have shown the effect of SES on health, the focus has been on traditional SES indicators and a limited array of health outcomes. This prevents researchers from applying emerging causal inference methods to provide policy makers with evidence supporting more targeted interventions - that is, which indicators, for which condition, for which population group.
This chapter builds on decades of previous work around the social determinants of health to focus on emerging economic and social indicators - including financial stress, area-level disadvantage, social support, social exclusion and job quality - measures that are increasingly recognised in public health research (Butterworth et al., 2010; Fachelli et al., 2025). This report uses nationally representative data to track the onset of mental health and multiple long-term health conditions over an extended period of follow-up and, in turn, uniquely examines how these health outcomes also impact social inequities.
Research in context
Evidence before this study
Evidence mostly from cross-sectional studies shows that lower socio-economic status is often associated with poorer health.
Evidence has also found a two-way relationship between socio-economic status and health conditions using cross-sectional data.
Added value
This study provides new insights into the two-way relationships of emerging economic and social indicators and health conditions for Australian men over an extended period of time.
By applying causal inference methods, we determine if, and which, economic and social indicators cause changes in health conditions and vice versa. This can be used to better target interventions designed to improve health outcomes for Australian men.
Research objectives
We aim to address the following research questions focusing on the two-way relationship between economic and social indicators and long-term health (mental health and physical health conditions) in Australian men. This study uses data from Waves 1 (2013-14) to 4 (2022) of the Ten to Men longitudinal survey.
1. How do the selected economic and social indicators influence health conditions?
1.1 What are the incidence rates of common mental health and long-term physical health conditions from 2013-14 to 2022, and how do they vary by priority population groups?
1.2 Which key economic and social indicators are associated with the incidence of mental health conditions and multiple long-term health conditions, and do these associations differ for men in priority population groups and their counterparts?
1.3 Are the observed associations consistent with a causal relationship?
2. How are these economic and social indicators influenced by health conditions?
2.1 What are the patterns of key economic and social indicators over time?
2.2 How have differences in key economic and social indicators between priority and non-priority groups changed over time?
2.3 How do health conditions influence the selected economic and social indicators over time, and do these estimates differ for men in priority population groups and their counterparts?
Methods
This section describes the key measures and data analysis techniques used to address the above research questions. The overall methodology of the Ten to Men study is detailed elsewhere (Swami et al., 2022; Volpe, 2024). Detailed information about the measures and analysis techniques used in this study is provided in the supplementary materials.
Measures
Economic and social indicators
We selected key individual and area-level indicators1 that reflect both economic and social dimensions, as described below. The rationale for selecting these indicators is outlined in the supplementary materials.
The 5 key indicators selected are:
- financial stress (ABS, 2017)
- social support (Sherbourne & Stewart, 1991)
- area-level disadvantage (ABS, 2021b)
- job quality (Butterworth et al., 2010, 2011)
- social exclusion (discrimination and unfair treatment) (Williams et al., 1997).
Financial stress
Across all 4 waves, respondents were asked if they had experienced any of the items listed in Table 1 over the past 12 months due to shortage of money. Most of the items in this report are similar to other studies, including the Household, Income and Labour Dynamics in Australia (HILDA) (Hayes & Watson, 2009) and the ABS Household Expenditure Survey and Survey of Income and Housing (ABS, 2017). However, the ABS measures financial stress at a household level and includes a higher number of items compared to Ten to Men. In this report, experiencing financial stress refers to responding 'yes' to at least one item, similar to the definition used by the ABS (2017).
| Item | Data collected |
|---|---|
| Could not fill/collect prescription | All waves |
| Could not get medical care | All waves |
| Could not pay bills on time | All waves |
| Could not pay mortgage/rent on time | All waves |
| Asked for financial help | All waves |
| Limited fruit and vegetables | Waves 1 and 2 |
| Could not go to the doctor | Waves 3 and 4 |
| Could not heat home | Waves 3 and 4 |
Social support
The Ten to Men survey includes the social support domain of emotional/informational support (Sherbourne & Stewart, 1991). This domain is assessed using 8 items, each rated on a 5-point Likert scale ranging from 'none of the time' to 'all of the time'.
The items include:
- Someone you can count on to listen to you when you need to talk
- Someone to give you good advice about a crisis
- Someone to give you information to help you understand a situation
- Someone to confide in or talk to about yourself or your problems
- Someone whose advice you really want
- Someone to share your most private worries and fears with
- Someone to turn to for suggestions about how to deal with a personal problem
- Someone who understands your problems.
For each participant, we derived the following variables:
- We calculated the mean score across the 8 items. A higher score indicates a higher level of perceived emotional/informational support (Sherbourne & Stewart, 2020).
- The mean score was grouped into 5 categories aligned with the original response scale of each item.
- A binary indicator was created to classify participants as having low social support or not.
Social exclusion
Social exclusion was measured with 2 items: discrimination; treated unfairly.
In Wave 1, respondents were asked how often they had experienced discrimination over the past 2 years. The possible responses were 'very often', 'fairly often', 'occasionally', 'rarely', and 'never'. We grouped these responses into 2 categories: 'Experienced discrimination' ('very often' to 'rarely)' versus 'Never experienced discrimination', based on the situation-based coding approach where everyone who experienced any discrimination is placed into one category (Krieger et al., 2005; Michaels et al., 2019).
In Waves 3 and 4, respondents were asked if they had been treated unfairly or badly in the last 6 months due to: 1) language or accent, 2) skin colour, 3) age, 4) disability, 5) religious beliefs, 6) cultural background, 7) mental health, or 8) sexual identity. Treated unfairly refers to responding 'yes' to at least one item.
Area-level disadvantage
Area-level disadvantage, developed by the ABS, is measured using the Index of Relative Socio-economic Disadvantage (IRSD) based on the index scores of all geographic areas at the Statistical Areas Level 1 (SA1). It ranks these areas based on relative socio-economic disadvantage, using data from the ABS Census of Population and Housing. Scores range from 1 (most disadvantaged areas) to 100 (least disadvantaged areas).
In this report, we grouped IRSD percentiles into 3 categories: high disadvantage (bottom 25%); middle disadvantage (middle 50%) and low disadvantage (top 25%). All individuals residing in the same SA1 share the same IRSD score.
Job quality
In the first 2 waves of the Ten to Men survey, 12 items were included to assess respondents' psychosocial job quality (Butterworth et al., 2010). Each item was rated on a 7-point Likert scale, ranging from 0 (strongly disagree) to 6 (strongly agree). Based on a validated framework, the items were grouped into 4 categories: job demands and complexity, job control, job security, and effort-reward fairness (see Table 2 and supplementary materials Table S2). Note: item 2, which assessed health consequences, was excluded from these categories in an updated version of this measure (Butterworth et al., 2011).
| Category | Item |
|---|---|
| Job demands and complexity | Item 1: My job is more stressful than I ever imagined Item 7: My job is complex and difficult Item 8: My job requires learning new skills Item 9: I use my skills in current job |
| Job control | Item 10: I have freedom to decide how I do work Item 11: I have a lot of say about what happens Item 12: I have freedom to decide when I do work |
| Job security | Item 4: I have a secure future in my job Item 5: Company, I work for will be in business in 5yrs Item 6: I worry about the future of my job (reversed) |
| Effort reward fairness | Item 3: I get paid fairly for the things I do in my job |
Source: Butterworth et al., 2011
Priority population groups
We included 7 of the 9 priority population groups highlighted in the National Men's Health Strategy (NMHS):
- men from culturally or linguistically diverse (CALD) backgrounds (measured by country of birth and language spoken at home)
- men living in regional and remote areas
- men with a disability
- men who did not identify as heterosexual
- Aboriginal and/or Torres Strait Islander men
- men with low social support (proxy for socially isolated men)
- men living in areas of high-disadvantage (proxy for socio-economically disadvantaged backgrounds).
Data were not available for the remaining 2 groups: veteran men and men in the criminal justice system. See supplementary materials, Measurements section and Table S3, for details.
Due to limitations in the available data, it was not always feasible to ensure adequate representation of all priority population groups across each research question. Further details on sample composition and representation are provided in the supplementary materials, Table S6 and Table S7.
Socio-demographic and behavioural factors
In addition to the economic and social indicators noted above, we included the following indicators as covariates: age, employment type, educational attainment, occupation, and household income. We also included relevant behavioural factors including smoking status, alcohol use, physical activity, frequency of medical check-ups, and dietary habits. Body mass index (BMI) is also included. See supplementary materials, Measurements section and Table S4, for details.
Health conditions
Health conditions as outcomes
Long-term health conditions, also referred to as noncommunicable diseases, are generally characterised by their persistent and long-lasting effects (AIHW, 2024a). The health indicators included in research question 1 were assessed among disease-free men in 2013-14 and are defined as follows:
- Multiple long-term health conditions indicate men who have been diagnosed with 2 or more long-term physical or mental health conditions for the first time within the 9-year period.
- Mental health conditions refer to men who have been diagnosed with at least one mental health condition for the first time within the 9-year period.
- Multiple long-term physical health conditions describe men who have been diagnosed with 2 or more long-term physical health conditions for the first time during the 9-year period.
The conditions included in research question 1 were measured based on whether participants who were disease-free as of Wave 1 (2013-14) were diagnosed with at least one of the 13 main conditions (see Table 3) and 51 sub-conditions2 after their Wave 1 survey completion date. Those who were diagnosed with these conditions as of Wave 1 survey completion date or with missing diagnosis date were excluded.
Health conditions as predictors
For research question 2, the predictors included whether participants had ever been diagnosed with a mental health condition over time (yes/no), number of long-term physical health conditions over time, and the severity of depression symptoms over time (none, mild, or moderate to severe). See supplementary materials, Table S1, Figure S1 and Table S5 for a list of all health conditions included in the analysis as well as the inclusion and exclusion criteria.
| Long-term physical health conditions | ||
|---|---|---|
| Asthma | Dementia | High cholesterol |
| Arthritis | Diabetes | Mild cognitive impairment |
| Autism | Hearing impairment | Stroke |
| Back/spine pain or injury | Heart disease | Sleep apnoea |
| Cancer | High blood lipids (fats) | Long-COVID |
| Chronic lung disease | High blood pressure | Free text for up to 5 additional conditions |
| Mental health conditions | ||
| Depression | Anxiety | Other mental health conditions |
The relationships between the economic and social indicators and health conditions
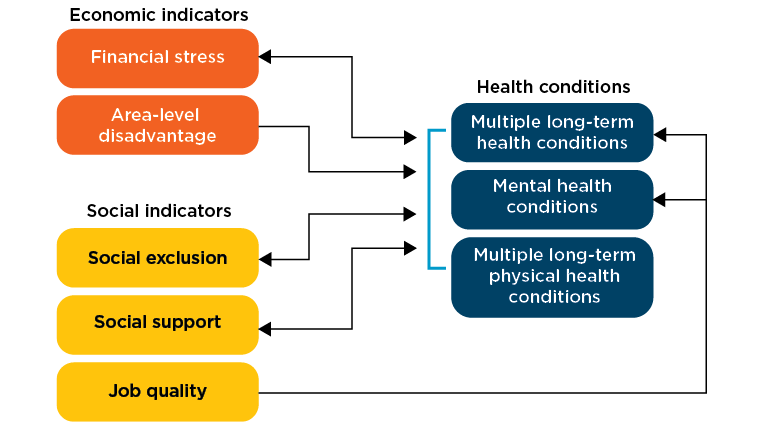
Figure 1 describes the two-way relationships between the selected economic and social indicators and health conditions. The double-headed arrows indicate bidirectional relationships. For research question 1, we assessed the effect of financial stress, area-level disadvantage, social exclusion (measured by discrimination), social support and job quality on the likelihood of being diagnosed with multiple long-term health conditions, mental health conditions and multiple long-term physical health conditions. We also examined the effect of job quality on mental health diagnosis. In research question 2, we examined the effect of health conditions on financial stress, social exclusion (measured by unfair treatment) and social support (measured by low social support: yes/no) over time.
Figure 1: Bidirectional relationships between economic and social indicators and health conditions
Sample size
Over 13,000 adult men were included in the study. Nearly 80% completed at least one follow-up survey. About half participated in Wave 4, and over three-quarters of them were disease-free at baseline (2013-14). However, attrition was disproportionately higher and the proportion of disease-free men lower in priority population groups. See Figure 2 and supplementary materials, Table S6 and Table S7.
Figure 2: Ten to Men survey sample size for the study
Data analysis
Analysis techniques for the research questions included estimation of incidence (new onset) rate, as well as measures of association using different statistical models such as Cox proportional hazard and Poisson regression models. When referring to associations in this report, we used the following terms: risk, effect estimate, association or risk/protective factors. While this is an observational study, we applied causal inference methods; therefore, we use these terms carefully and avoid terms that imply causality, such as impact. These methods are summarised in Table 4 and detailed in the supplementary materials, 'Data analysis' section.
| RQ | Outcome | Exposure | Confounders | Analysis | Notes |
|---|---|---|---|---|---|
| 1.1 | Each common mental health and physical health condition Multiple long-term health conditions 1+ mental health conditions Multiple long-term physical health conditions | Age at Wave 1 Priority population groups at Wave 1 | Incidence rate per person-years | Described how quickly (i.e. the rate at which) the outcomes occur during the 9-year period, accounting for varying follow-up times, in disease free men at the start of the follow-up period (Wave 1) | |
| 1.2 | Multiple long-term health conditions 1+ mental health conditions Multiple long-term physical health conditions | Key economic and social indicators at Wave 1 | Socio-demographic indicators at Wave 1 Priority population groups at Wave 1 Behavioural and other factors at Wave 1 | Association | Applied Cox proportional hazards to examine the association between the key economic and social indicators at Wave 1 (treated as exposures) and each of the outcomes |
| 1.3 | Multiple long-term health conditions 1+ mental health conditions Multiple long-term physical health conditions | Key economic and social indicators at Wave 1 | Socio-demographic indicators at Wave 1 Priority population groups at Wave 1 Behavioural and other factors at Wave 1 | Causal relationship | Applied inverse probability weight to determine the causal effect of each key economic and social indicator, adjusted for the potential confounders and baseline factors |
| 2.1 | Key economic and social indicators at Waves 1-4 Financial stress Social support Area level disadvantage | Age at Waves 1-4 Priority population groups at Waves 1-4 | Trend analysis | Analysed trends of key economic and social indicators using weighted percentages and 95% confidence intervals (95% CI) across time Used chi-square test to determine difference between groups in each wave Tracked participants across each category of the indicators illustrating how their status changed in each wave | |
| 2.2 | Financial stress at Waves 2-4 | Health predictors at Waves 1-3 | Socio-demographic indicators at Waves 1-3 Priority population groups at Waves 1-3 Behavioural and other factors at Waves 1-3 | Association and predicted probability | Used mixed effects linear models to assess the association between health predictors and financial stress over time in those without financial stress in Wave 1 Predictors were taken from Waves 1-3 while the outcome was taken from Waves 2-4 to help maintain proper temporal sequencing, with exposures preceding the outcome. This approach recognises that financial stress measures status over the preceding 12 months, whereas predictors reflect conditions at the time of the survey. Those with financial stress in Wave 1 were excluded as it affects the outcome (financial stress in Waves 2-4) and the predictors (Waves 1-3) Calculated the predicted probability by each predictor, adjusted for the confounding factors |
| Low social support at Waves 1-4 | Health predictors at Waves 1-4 | Socio-demographic indicators at Waves 1-4 Priority population groups at Waves 1-4 Behavioural and other factors at Waves 1-4 | Association and predicted probability | Applied mixed effects models Applied predictors and outcomes from the same waves as the outcome also shows the status at the time of the survey Calculated the predicted probability by each predictor, adjusted for the confounding factors | |
| Unfair treatment at Wave 4 | Health predictors at Wave 3 | Socio-demographic indicators at Wave 3 Priority population groups at Wave 3 Behavioural and other factors at Wave 3 | Association and predicted probability | Applied Modified Poisson regression Unfair treatment data, reflecting experiences in the 6 months prior to the survey, were collected in Waves 3 and 4. To help maintain proper temporal sequencing, predictors (health indicators at the time of the survey) were taken from Wave 3, while the outcome was drawn from Wave 4 |
Determining causal relationships using inverse probability weighting (IPW)
Inverse probability weighting (IPW) is a statistical technique used to address biases in observational data, particularly when estimating causal effects. It works by assigning weights to each observation based on the inverse of the probability of receiving a particular treatment or exposure (in this case, each of the key economic and social indicators) given the observed covariates.
For researchers and policy makers, IPW offers a robust approach to derive more reliable causal estimates from observational data. By accounting for differences in exposure assignment, it enables the estimation of counterfactual outcomes - what would have happened if a different exposure was experienced. This is particularly valuable in policy development or evaluation, where understanding the causal impact of a range of factors is critical for informed decision making.
Missingness
There was a high dropout rate among those who experienced financial stress compared to those who did not (See supplementary materials, Table S6, Table S7 and Table S8). To reduce bias, we applied a population carryover method (Hayes & Watson, 2009). This method calculates the probability of carrying a value forward or backward by comparing the reported changes between consecutive waves.
Findings
New diagnoses (incidence) of health conditions
For disease-free men aged 18-55 years, the occurrence of new diagnoses of health conditions varied by population group. Overall, the rates were higher in priority population groups compared to non-priority population groups.
Around 2% of men (21 per 1,000) were diagnosed with multiple long-term health conditions each year over the 9 years to 2022 (Table 5). This equates to around 132,000 additional men each year.
Around 9 in 1,000 men were diagnosed with one or more mental health conditions per year, with depression the most common new diagnosis (7 diagnoses per 1,000 men per year).
Around 16 in 1,000 men were diagnosed with multiple long-term physical health conditions per year. The most common new diagnosis was high blood pressure (12 diagnoses per 1,000 men per year), followed by long COVID (11 diagnoses per 1,000 men per year) and high cholesterol (11 diagnoses per 1,000 men per year).
| Condition | Number diagnosed per 1,000 men per year | Number of Australian men diagnosed per year |
|---|---|---|
| Multiple long-term health conditions | 20.76 | 131,699 |
| Mental health conditions | 9.49 | 60,206 |
| Multiple long-term physical health conditions | 15.75 | 99,930 |
| High blood pressure | 12.22 | 77,539 |
| Long COVID | 11.02 | 69,899 |
| High cholesterol | 10.95 | 69,440 |
| Back/spine pain or injury | 6.89 | 43,692 |
| Depression | 6.86 | 43,498 |
| Anxiety | 5.26 | 33,333 |
| Sleep apnoea | 4.90 | 31,076 |
| Other health condition | 4.71 | 29,874 |
| Arthritis | 4.03 | 25,544 |
| High blood lipids | 3.72 | 23,601 |
| Cancer | 2.57 | 16,284 |
| Hearing impairment | 2.42 | 15,337 |
| Type 2 diabetes | 2.42 | 15,337 |
| Heart disease | 2.80 | 17,736 |
| Other mental health | 1.49 | 9,467 |
| Asthma | 1.11 | 7,038 |
Notes: Sample consists of men aged 18+ years in Wave 1 (2013-14) who were free of 64 long-term health conditions, listed in Table S3, as of 2013-14 and who participated in Wave 4 (N = 4,118).
Source: Ten to Men Waves 1 and 4
Rates of mental health conditions varied by age and priority population group. Younger men had substantially higher rates - 14 new diagnoses per 1,000 men per year in men aged 18-29, compared to 6 per 1,000 men per year in those aged 50 years and over. Rates were also higher in men with disabilities - 11 new diagnoses per 1,000 men per year, compared to 8 per 1,000 men per year for men without disabilities. See Figure 3 and supplementary materials, Table S10.
Rates of multiple long-term physical health conditions also varied by age and priority population group. Men aged 50 years and over had more than 4 times the rate of new diagnoses than men aged 18-29 years. Men with disabilities had a higher rate compared to men without disabilities (19 compared to 13 new diagnoses per 1,000 men per year), while men born in Australia had a higher rate compared to men born in non-English-speaking countries (17 compared to 11 diagnoses per 1,000 men per year).
The rate of multiple long-term physical health conditions also varied by other factors - for example, BMI, with the rate of new diagnoses for men classified as obese nearly 3 times higher than the rate for men classified as not obese. Similarly, rates of multiple long-term health conditions varied by age, priority population groups and other factors. See Figure 3 and supplementary materials, Table S10.
Figure 3: Incidence rate of mental health, multiple long-term physical health and multiple long-term health conditions by priority population groups
Notes: Sample consists of men aged 18+ years in Wave 1 (2013-14) who were free of 64 long-term health conditions listed in supplementary materials, Table S1 as of Wave 1 and who participated in Wave 4 (N = 4,118). *Indicates not a significant difference between groups for all 3 outcomes. **Indicates not a significant difference between groups for multiple long-term physical health conditions.
Source: Ten to Men Waves 1 and 4
Association of economic and social factors with new diagnoses of health conditions
Economic and social factors were independently associated with new diagnoses of health conditions for men (Figure 4 and supplementary materials, Table S11, Table S12 and Table S13).
Financial stress was a risk factor for new diagnoses of both mental health and multiple physical health conditions, while discrimination was a risk factor for multiple long-term physical health conditions.
Experiencing financial stress increased the risk of multiple long-term health conditions by 23% over the 9-year period, controlling for all confounding factors. A 53% increased risk was observed for 1+ mental health conditions, and a 29% increased risk for multiple long-term physical health conditions. Experiencing discrimination increased the risk of multiple long-term health conditions by 18%, and of multiple long-term physical health conditions by 28%.
Having social support and high job control (1 of the 4 job quality measures) were protective factors for new diagnoses of mental health conditions. Those who had social support all of the time had a 34% lower risk of being diagnosed with mental health conditions compared to those with no or low social support. For each additional job control score, the risk of being diagnosed with new mental health condition/s reduced by 13%.
Figure 4: Association between economic and social factors and health outcomes - new onset mental health conditions, multiple physical health conditions and multiple long-term health conditions3
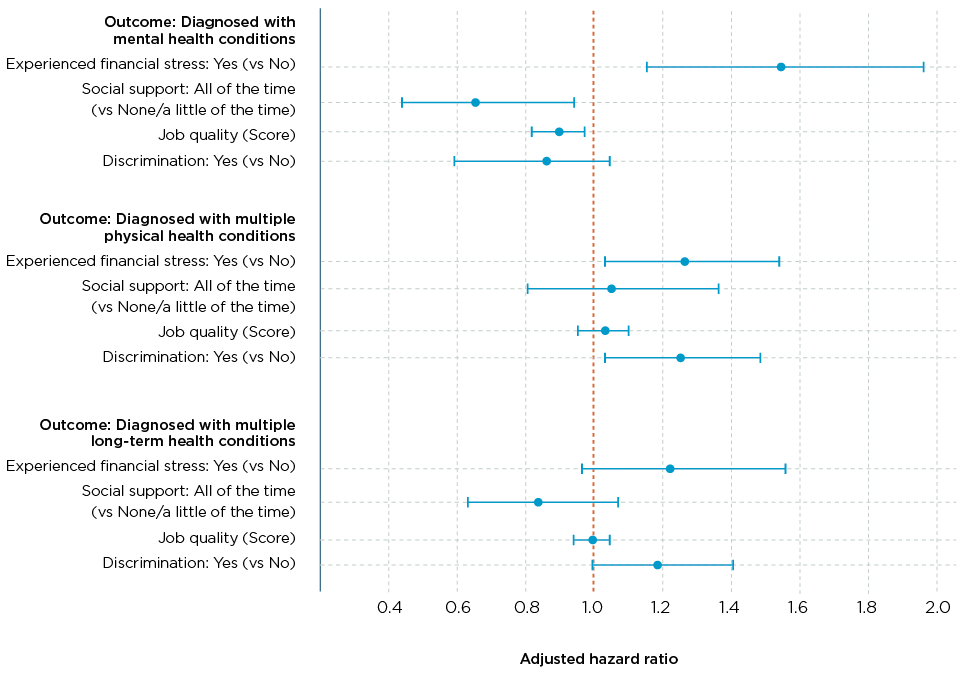
Notes: Sample consists of men aged 18+ years in Wave 1 (2013-14) who were free of 64 long-term health conditions listed in Table S1 as of Wave 1 and who participated in Wave 4 (N = 4,118). Lines represent confidence limits.
Source: Ten to Men Waves 1 and 4
We applied IPW for all predictors. Overall, the associations using adjusted regression models (presented above) were highly consistent with the results obtained with the causal IPW model. While multivariable regression models adjust for multiple confounders in observational studies, the IPW model provides further evidence of a direct role between the highlighted economic and social indicators and the new onset of health conditions. See supplementary materials for further details.
Changes in economic and social factors over time
Financial stress
Based on our best estimate,4 the majority of participants (59%) did not experience financial stress over the 9-year period. About 17% experienced financial stress consistently in all waves. Almost one-quarter (24%) experienced financial stress in some waves (see Figure 5 and supplementary materials, Table S17 and Table S18).
Figure 5: Patterns of financial stress over time
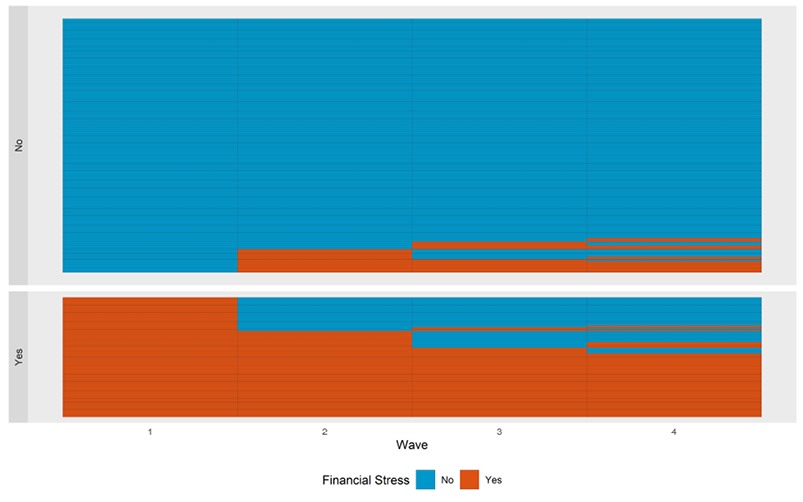
Notes: Sample consists of men aged 18+ years in Wave 1 (2013-14) (N = 13,640) with observed and imputed values in all waves.
Source: Ten to Men data Waves 1 to 4
The estimated proportion of participants who experienced financial stress decreased from 32% in 2013-14 to 26% in 2022. While the proportions appear to be decreasing across all priority population groups, they remain higher for younger men, non-heterosexual men, men with disabilities, men living in regional/remote areas and men living in more disadvantaged areas, compared to those not in these groups (see Figure 6).
Figure 6: Financial stress by priority population groups
Notes: Sample consists of imputed number of participants for each wave.
Source: Ten to Men Waves 1 and 4
Of the 8 financial stress items participants were asked about, the most frequently reported were 'asking for financial help' and 'not being able to pay bills on time', which were also the 2 items that showed the largest decreases over time.
Across time, these were also the 2 most frequently reported items for men across all priority population groups, with the proportions highest for men with disabilities, those living in regional or remote areas, non-heterosexual men and men residing in high disadvantage areas. Over half of those men who couldn't pay bills on time also asked for financial help.
Area level of disadvantage
Around 3 in 5 participants remained living in geographic areas of a similar level of disadvantage over the 9-year period (see Figure 7 and supplementary materials, Table S15). Around 3 in 5 men (63%) lived in middle disadvantage areas across the 9-year period. Around 1 in 5 (19%) moved from these areas to high disadvantage areas, and the remaining 1 in 5 (18%) moved from these areas to low disadvantage areas. Similarly, around 3 in 5 men (62%) and just under 3 in 5 men (57%) consistently lived in areas of low and high disadvantage respectively over the 9-year period.
Figure 7: Disadvantage level of the geographic area where participants live
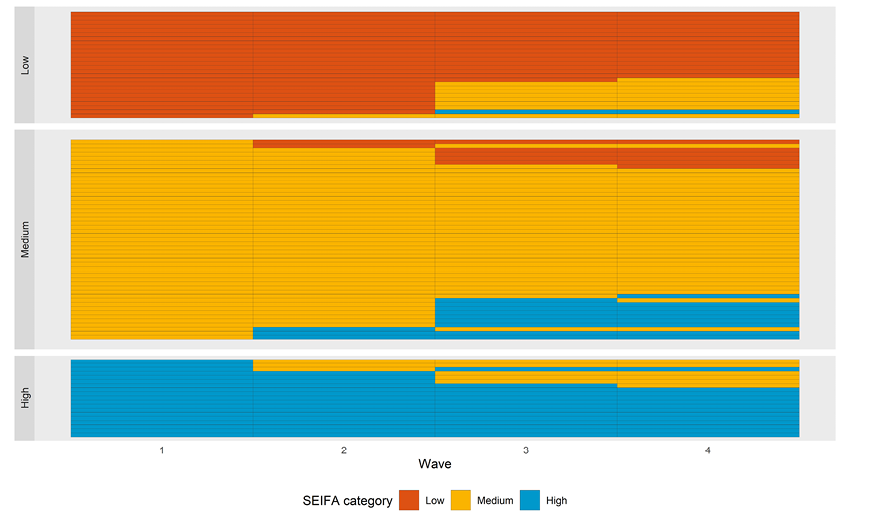
Notes: Sample consists of men aged 18+ years at Wave 1 (2013-14) who participated in all waves and had a non-missing SEIFA IRSD score (N = 5,054). Each row represents 1% of the sample. Patterns with < 1% (after rounding) are excluded.
Source: Ten to Men Waves 1 to 4
Social support
Social support was generally available for most respondents, with over 70% having some support for at least 1 of the 8 items. However, the proportion of participants reporting low social support (on average, support none or less than a little of the time for all items) increased from 9% in Wave 1 to 14% in Wave 4 (see Figure 8 and supplementary materials, Table S14).
In each wave, the proportion of men reporting low social support was higher among older age groups, men with disabilities, men who speak a language other than English at home, men born in non-English-speaking countries and men living in areas of high socio-economic disadvantage (see Figure 8).
Figure 8: Low social support by priority groups
Notes: Sample consists of men aged 18+ years in Wave 1 who responded to social support items in each respective wave. *Not a significant difference by age groups in Waves 1 and 4. **Not a significant difference by sexual identity in Waves 3 and 4. ***Not a significant difference by country of birth in Wave 2. ****Not a significant difference by language spoken at home in Waves 2 and 4. **Not a significant difference by Indigenous status in Waves 1, 3 and 4. *****Not a significant difference by remoteness in all waves.
Source: Ten to Men Waves 1 to 4
The most common concern, including for all priority population groups, was not having 'someone to share worries/fears' with, with 27% reporting support none or a little of the time in Wave 4 (see supplementary materials, Table S19).
Job quality
Job quality scores were similar in 2013-14 and 2015-16 (Figure 9). Job quality measures were lower in younger men, men with disabilities and men living in high disadvantage areas. See supplementary materials, Table S21.
Figure 9: Mean score of job quality categories
Notes: Sample consists of men aged 18+ years at Wave 1 (2013-14) who responded to job quality measure items in Wave 1 or Wave 2 (the 2 available time points for these data). Error bars indicate the 95% confidence interval.
Source: Ten to Men Waves 1 and 2
Discrimination and unfair treatment
In 2013-14, around half of men (52%) reported that they had not experienced discrimination in the previous 2 years, with 29% reporting they experienced it rarely and 19% reporting they experienced it very often to occasionally.5 The proportion reporting they experienced discrimination (ranging from rarely to very often) was higher for non-heterosexual men, men who speak a language other than English at home, men born in non-English-speaking countries, men with disabilities, men living in major cities and men living in disadvantaged areas, compared to their counterparts (see Figure 10).
Figure 10: Proportion of respondents reporting discrimination in the last 2 years
Notes: Sample consists of men aged 18+ years at Wave 1 (N = 13,290) who responded to discrimination question in Wave 1.
Source: Ten to Men Wave 1
In 2020-21 and 2022 respondents were asked if they had been treated unfairly or badly in the 6 months preceding the survey for any of 11 reasons.6 Over 1 in 6 reported they had been treated unfairly or badly due to at least one of the reasons, with the most frequently reported reason being physical appearance. The proportion reporting unfair treatment was higher for non-heterosexual men, men born in non-English-speaking countries, men with disabilities and men living in disadvantaged areas, compared to their counterparts (see Figure 11 and supplementary materials, Table S22).
Figure 11: Proportion of respondents reporting unfair treatment in the last 6 months
Notes: Sample consists of men aged 18+ years at Wave 1 (2013-14) who responded to unfair treatment items in Waves 3 and 4. *Remoteness and language spoken at home: the differences are not significant in both waves. **Country of birth: The difference is only significant in Wave 4.
Source: Ten to Men Waves 3 and 4
Association of health conditions and economic and social factors
The economic and social factors reported here are the subset of those in the previous section that could be amenable to influence by health conditions (i.e. financial stress, social support and unfair treatment).
Financial stress
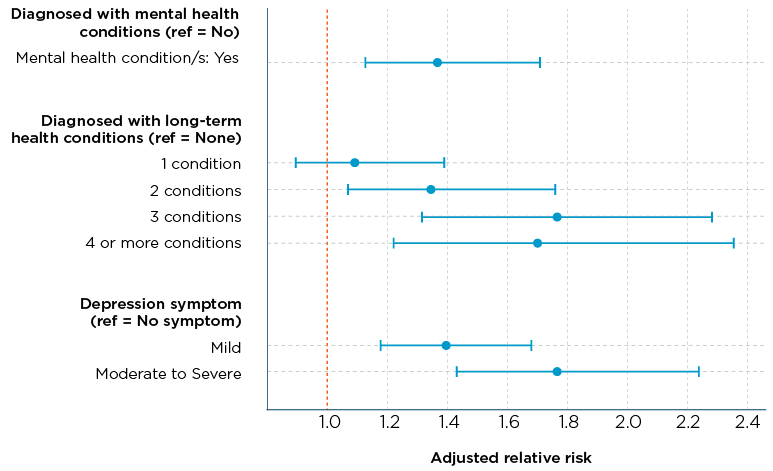
Men diagnosed with health conditions (mental health and long-term physical health) were generally more likely to experience financial stress, compared to those who had never been diagnosed (Figure 12). The likelihood was highest for men with moderate to severe depression symptoms, who were 78% more likely to experience financial stress compared to those without depression symptoms. A similar high likelihood (around 70%) was seen for men diagnosed with 3 or more long-term physical health conditions, compared to men with no diagnoses of these conditions.
Figure 12: Association between health indicators and financial stress
To test whether the associations shown in Figure 12 remained the same over time, we estimated the predicted probability of men experiencing financial stress following the onset of selected health conditions (and after adjusting for additional factors).
The predicted probability of men experiencing financial stress in 2015-16 was higher for those with moderate to severe depressive symptoms in 2013-14 compared to those without symptoms (Figure 13). This gap between the groups widened over time, with the largest difference observed in 2022. The predicted probability of experiencing financial stress was also higher among those with diagnosed mental health conditions compared to those without, with this gap remaining stable over time (Figure 14).
Figure 13: Proportion with financial stress over time by depression symptom status in previous waves
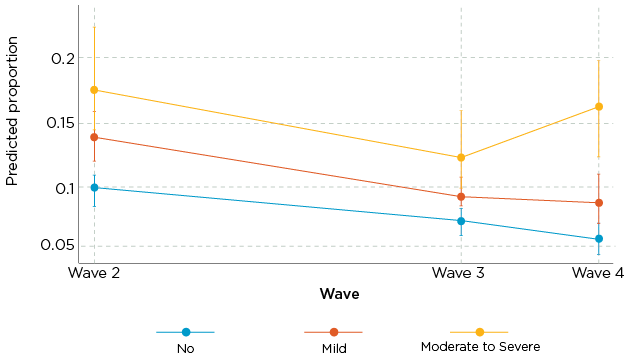
Figure 14: Proportion with financial stress over time by diagnosis of mental health condition/s in previous waves
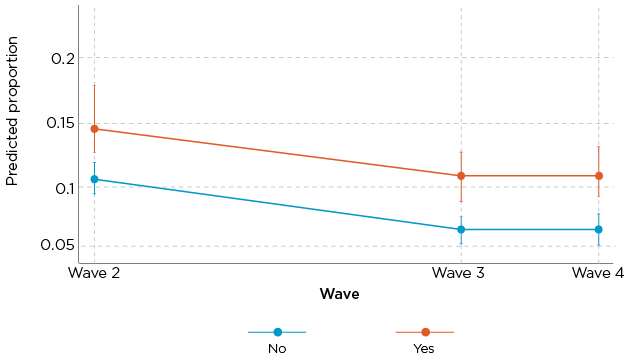
Notes: Sample consists of men aged 18+ years in Wave 1 (2013-14) who had valid responses to the variables/items included in the analysis. The adjusted model is based on a multilevel mixed effects generalised linear model. To help maintain proper temporal sequencing, predictors were drawn from Waves 1-3, while the outcome - financial stress - was measured in Waves 2-4. This approach was chosen because financial stress reflects the status during the 12 months preceding the survey, whereas health predictors indicate diagnoses or symptoms present at the time of the survey. The model is adjusted for age, socio-demographic indicators, priority population groups and behavioural factors. See supplementary materials, Table S23 for full model.
Source: Ten to Men Waves 1 to 4
Low social support
Men diagnosed with mental health conditions were 40% more likely to experience low social support compared to those without these diagnoses. Further, those with moderate to severe depression symptoms were more than 3 times as likely to experience low social support compared to those without depression, and those with mild depression were almost twice as likely to experience low social support (Figure 15).
Men diagnosed with 1 or 2 long-term physical health conditions were less likely to experience low social support compared to those without these diagnoses.
Figure 15: Association between health indicators and low social support
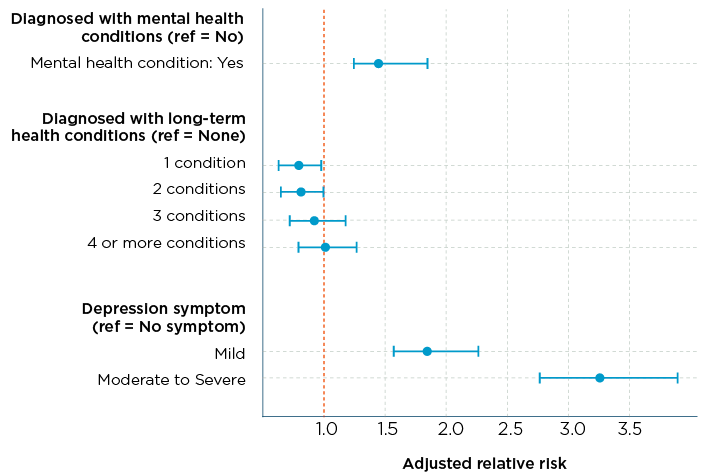
Notes: Sample consists of men aged 18+ years in Wave 1 (2013-14) who had valid responses to the variables/items included in the analysis. The adjusted model is based on a multilevel mixed effects generalised linear model. Lines represent confidence limits.
Source: Ten to Men Waves 1 to 4
The predicted probability of men reporting low social support in 2013-14 was higher in those with depressive symptoms and those diagnosed with a mental health condition in the same wave, controlling for confounders. However, this gap had narrowed by 2020-21 for mental health diagnoses and by 2022 for depressive symptoms (see Figures 16 and 17).
Figure 16: Proportion of low social support across time by level of depression symptoms, adjusted for other factors
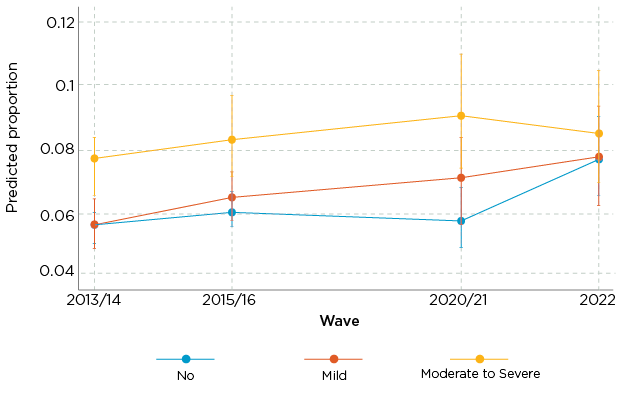
Figure 17: Proportion of low social support across time by whether ever diagnosed with a mental health condition, adjusted for other factors
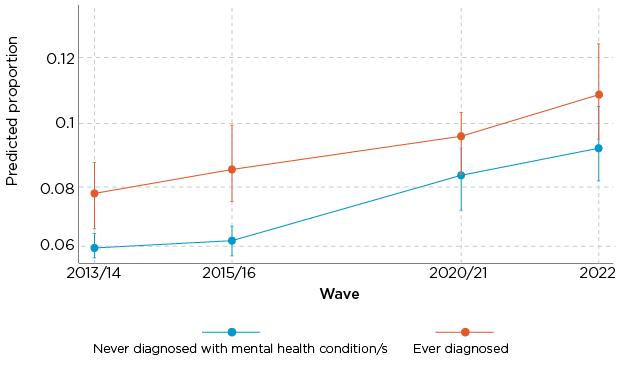
Notes: Sample consists of men aged 18+ years in Wave 1 (2013-14) and had a valid response to the variables/items included in the analysis. The adjusted model is based on a multilevel mixed effects generalised linear model, adjusted for age, socio-demographic indicators, priority population groups and behavioural factors. Vertical lines represent confidence limits.
Unfair treatment
Men diagnosed with mental health conditions were 44% more likely to report unfair treatment compared to those who had never been diagnosed with these conditions (Figure 18). Similar to the results for low social support, the likelihood was considerably higher for men with depressive symptoms.
Figure 18: Association between health indicators and unfair treatment
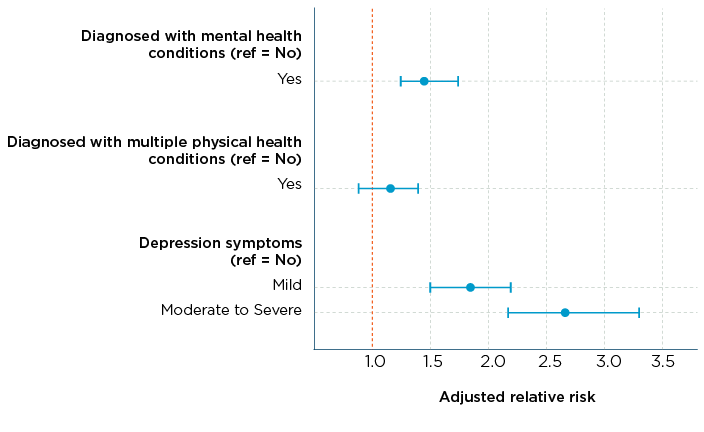
Notes: Unfair treatment data, reflecting experiences in the 6 months prior to the survey, was collected in Waves 3 and 4. To help maintain proper temporal sequencing, predictors (health indicators at the time of the survey) were taken from Wave 3, while the outcome was drawn from Wave 4. Lines represent confidence limits. See supplementary materials, Table S24 for full model.
Source: Ten to Men Waves 3 and 4
Summary
This report uses nationally representative longitudinal data to investigate the bidirectional nature of a selection of economic and social indicators and health conditions for Australian men over a 9-year period. These findings show modifiable factors that have contributed to increasing levels of health conditions in Australian men, along with health conditions that have affected selected economic and social indicators. Where possible, the effect for men in priority populations has also been considered.
Rates of new diagnoses of health conditions increase for men, and more so for men in some priority populations
The prevalence of common health conditions has been reported in Australia (ABS, 2022b; AIHW, 2024a) and in other countries, such as the United Kingdom (NHS digital, 2024). However, there is limited evidence on population-level incidence rates in disease-free populations in Australia outside of specific population groups, such as women (Jackson et al., 2015), and a limited number of health conditions (Shang et al., 2020).
Our study estimates that over the 9 years to 2022, nearly 132,000 additional Australian men (aged 18-55 years in 2013-14) were diagnosed with multiple long-term health conditions each year. More than 60,000 men were diagnosed with one or more mental health conditions each year, and nearly 100,000 men were diagnosed with multiple long-term physical health conditions every year.
Our study also finds that new diagnoses of health conditions disproportionately affects men in some priority population groups. The rates for new diagnoses of mental health conditions were higher among men with disabilities compared to men without disabilities. For long-term health conditions, rates of new diagnoses were higher for men with disabilities, along with men who were overweight (BMI>30).
More men are reporting little or no social support but fewer are reporting financial stress
Men's rates of low social support increased over the 9-year period from 2013-14. This aligns with recent evidence that shows Australia's overall social cohesion has fallen (O'Donnell, 2022). Further, rates of low social support continued to be higher for older men, men with disabilities, men who speak a language other than English at home, men born in non-English-speaking countries and men living in more disadvantaged areas.
Based on our best estimates, the proportion of participants experiencing financial stress declined from 2013-14 and 2015-16 to 2020-21 and 2022. While this trend aligns with findings from other recent studies (Biddle & Gray, 2022; Sherbourne & Stewart, 2020; Wilkins et al., 2022), financial stress in this cohort may be somewhat underestimated. Men in our study are generally proficient in English, employed and educated and fall within mid-to-high income ranges (Quinn & Martin, 2022; Swami et al., 2022), all factors associated with lower levels of financial stress.
The potential underestimated rates in the later waves could also be due to sample attrition, as those in financial stress are more likely to leave the study. To address this, we applied statistical weights to reduce non-response bias and used imputation techniques to estimate missing data more accurately.
While the proportions of men in financial stress declined for the priority populations reported, they remained higher for younger men, non-heterosexual men, men with disabilities, men living in more remote areas and men living in more disadvantaged areas, compared to their counterparts.
Rates of unfair treatment and job quality were only available for 2 time points (both 2 years apart) and showed no change over the short time period.
Financial stress and discrimination increase the risk of health conditions, while social support and job control reduce the risk …
Our study found that financial stress and discrimination both increased the risk of new diagnoses of multiple long-term physical health conditions. Financial stress also increased the risk of new diagnoses of mental health conditions. Higher social support and job control reduced the risk of new diagnoses of mental health conditions.
Financial stress increased the risk of a new mental health diagnosis by 53% and multiple long-term physical health conditions by 29%. A recent study also showed that financial stress continues to impact the personal and social wellbeing of Australians (O'Donnell et al., 2024).
Discrimination increased the risk of a new diagnosis of multiple long-term physical health conditions by 28%. Research suggests that people experiencing discrimination may be experiencing this in health care and/or other service settings, which can impact their health outcomes (Hayanga et al., 2023).
The causal association in our study also highlighted that social support and higher job control reduced the risk of new mental health conditions (by 34% and 13% respectively). Previous cross-sectional studies have shown similar associations (Bruss, 2024; Harandi et al., 2017; Wang et al., 2024). Mental health and individual characteristics also influence how social support is perceived and the extent to which it is available (Turner & Brown, 2010).
… in the opposite direction, health conditions increase the risk of financial stress, a lack of social support and unfair treatment
Our study shows that health conditions are associated with financial stress and low social support over time. For example, men with moderate to severe depression symptoms had a 78% higher risk of experiencing financial stress and were more than 3 times as likely to report low social support compared to those without depression symptoms. Evidence shows long-term health conditions can increase financial burdens from medical expenses, reduced work capacity and the need for ongoing care (Cutler, 2022; Guan et al., 2022). Mental ill health can also reduce social support by causing withdrawal, while strong social support can help in mental health recovery (Bjørlykhaug et al., 2022).
Our analysis also indicates that those with mental health conditions are more likely to experience unfair treatment. This includes unfair treatment due to body appearance, age, skin colour, cultural backgrounds or disability. This issue has been widely reported in Australia and internationally (Krnjacki et al., 2018; Puhl & Brownell, 2013).
Data considerations
The Ten to Men survey data include extensive information on social determinants of health, surpassing other Australian longitudinal studies (Flavel et al., 2022). A major strength of this research is also the longer follow-up period. The consistent measurement of key variables across time facilitates the reliability of the findings. Moreover, we have applied stronger statistical models to address the issues of reverse causality.
However, there are some limitations. The reliance on self-reported data may introduce bias, as respondents might under- or over-report their health conditions and SES. Further, not all respondents who were not diagnosed with the conditions as of Wave 1 could be considered disease-free because not being diagnosed does not necessarily mean they did not have the conditions. Finally, the study experienced higher dropout rates among certain groups over the 9-year period, which could lead to bias. This last point is mitigated in part by appropriate imputation techniques.
Future research opportunities
This study provides valuable data on the incidence of multiple long-term health conditions, focusing on both mental and long-term physical health conditions, among a disease-free cohort, contributing to the understanding of health trajectories over time. The longitudinal approach helps explain the causal relationships between key economic and social indicators and health conditions over time. Further analysis, with a longer follow-up period, would provide more detailed insights into the health profiles of different population groups.
Priority population groups were underrepresented in some of the analyses due to the inclusion criteria, which excluded men with pre-existing health conditions or those experiencing financial stress at baseline. Upcoming data from the Ten to Men top-up sample and subsequent waves will include a larger, representative cohort, providing opportunities to conduct more detailed subgroup analyses.
Finally, future analyses could leverage data linkage included in the Ten to Men study - such as Medicare Benefits Schedule (MBS) data that provide detailed records of treatment for specific health conditions - to reduce reliance on self-reported measures and examine more complex pathways between social determinants and health outcomes.
Key conclusions for policy and practice
1. Bidirectional findings suggest a cross-portfolio approach
Mental health and long-term conditions not only result from socio-economic disadvantage but also contribute to it - through reduced productivity, increased health care costs and diminished socio-economic mobility. Previous evidence suggests that economic and social factors have a greater impact on health than health has on these factors (Letelier et al., 2022; Warren, 2009). However, our study shows strong effects in both directions. This interplay reinforces the need for sustainable, integrated approaches - including cross-portfolio strategies and coordination between levels of government - to address the complex and reciprocal relationship between health and socio-economic conditions.
2. Improve job quality and financial support for at-risk groups
People experiencing financial stress or poor job quality are at higher risk of both mental and physical health conditions. Poor job quality - characterised by low control - is increasingly linked to long-term illness. Improving job quality standards, ensuring fair work practices and providing adequate financial support mechanisms may help reduce health risks. These efforts also align with broader strategies to reduce the incidence of long-term health conditions and improve key economic indicators.
3. Strengthen support for socially excluded and disadvantaged communities
Individuals facing area-level disadvantage or social exclusion (e.g. discrimination, lack of support networks) are particularly vulnerable. These factors not only predict poorer health outcomes but also limit recovery and socio-economic mobility. Areas of focus could include community-level infrastructure, anti-discrimination policies and targeted social supports. Robust monitoring and reporting mechanisms for these social factors could help track progress and guide future investment.
4. Tailor interventions to break cycles of compounding disadvantage
Some groups experience compounding disadvantage and may need tailored interventions. For example, men with low social support and depression - where the relationship is mutually reinforcing - are particularly vulnerable. With a high proportion of men being diagnosed with mental health conditions for the first time each year, and the rate of low social support continuing to rise, these men may benefit from integrated service models combining mental health care with social connection initiatives.
5. Deliver inclusive and timely responses for priority populations
Priority populations - such as men living with disabilities - face higher levels of many of the upstream drivers of health inequity (social exclusion, low social support, poor job quality and financial stress), which, in turn, have been shown to further entrench their socio-economic disadvantage. These intersecting challenges require targeted, inclusive and timely interventions that reflect their lived experiences and improve access to support services.
6. Incentivise cross-sector collaboration with a focus on culturally inclusive service delivery
Integrated efforts across health, social, employment, and multicultural sectors are needed to address the link between socio-economic disadvantage and health, however these efforts can be siloed. Government support that fosters greater collaboration and capacity to deliver culturally tailored interventions where needed (e.g. Mental Health in Multicultural Australia [MHiMA], 2014) shows promise in delivering improved, shared outcomes for these sectors.
References
Adonteng-Kissi, O., Mabefam, M., Archibong, E., Meribe, N., & Baffour, F. D. (2025). Impact of perceived discrimination and social exclusion on wellbeing of Black African immigrants in Australia. Race and Justice, 21533687251356287.
Ahnquist, J., Wamala, S. P., & Lindstrom, M. (2012). Social determinants of health - a question of social or economic capital? Interaction effects of socioeconomic factors on health outcomes. Social Science & Medicine, 74(6), 930-939.
Australian Bureau of Statistics (ABS). (2017). Household Expenditure Survey and Survey of Income and Housing, user guide, Australia, 2015-16. ABS. abs.gov.au/ausstats/[email protected]/Lookup/by%20Subject/6503.0~2015-16~Main%20Features~Deprivation%20and%20financial%20stress%20indicators~12
Australian Bureau of Statistics. (2021a). First insights from the National Study of Mental Health and Wellbeing, 2020-21. ABS. abs.gov.au/articles/first-insights-national-study-mental-health-and-wellbeing-2020-21
Australian Bureau of Statistics. (2021b). Socio-Economic Indexes for Areas (SEIFA), Australia. ABS.
abs.gov.au/statistics/people/people-and-communities/socio-economic-indexes-areas-seifa-australia/latest-release
Australian Bureau of Statistics. (2022a). National Health Survey: Information on health behaviours, conditions prevalence, and risk factors in Australia. ABS. abs.gov.au/statistics/health/health-conditions-and-risks/national-health-survey/2022
Australian Bureau of Statistics. (2022b). Health conditions prevalence: Key findings on long-term health conditions and chronic conditions, and prevalence in Australia. ABS. abs.gov.au/statistics/health/health-conditions-and-risks/health-conditions-prevalence/latest-release#footnotes
Australian Bureau of Statistics. (2023). National Study of Mental Health and Wellbeing. ABS. abs.gov.au/statistics/health/mental-health/national-study-mental-health-and-wellbeing/latest-release
Australian Institute of Health and Welfare (AIHW). (2023). Australian Burden of Disease Study 2023. AIHW. aihw.gov.au/reports/burden-of-disease/australian-burden-of-disease-study-2023/contents/summary#Introduction
Australian Institute of Health and Welfare. (2024a). Chronic conditions. AIHW. aihw.gov.au/reports/australias-health/chronic-conditions
Australian Institute of Health and Welfare. (2024b). Multimorbidity. AIHW. aihw.gov.au/reports/australias-health/multimorbidity
Australian Institute of Health and Welfare. (2024c). Social determinants of health. AIHW. aihw.gov.au/reports/australias-health/social-determinants-of-health
Barakat, C., & Konstantinidis, T. (2023). A review of the relationship between socioeconomic status change and health. International Journal of Environmental Research and Public Health, 20(13), 6249.
Bialowolski, P., Weziak-Bialowolska, D., Lee, M. T., Chen, Y., VanderWeele, T. J., & McNeely, E. (2021). The role of financial conditions for physical and mental health: Evidence from a longitudinal survey and insurance claims data. Social Science & Medicine, 281, 114041.
Biddle, N., & Gray, M. (2022). Economic and other wellbeing in Australia-October 2022. ANU Centre for Social Research and Methods.
Bjørlykhaug, K. I., Karlsson, B., Hesook, S. K., & Kleppe, L. C. (2022). Social support and recovery from mental health problems: A scoping review. Nordic Social Work Research, 12(5), 666-697.
Blázquez, M., Cottini, E., & Herrarte, A. (2014). The socioeconomic gradient in health: How important is material deprivation? The Journal of Economic Inequality, 12, 239-264.
Boast, J. (2018). Making more of multimorbidity: An emerging priority. Lancet, 391(10131), 1637.
Bruss, K. V. (2024). Loneliness, lack of social and emotional support, and mental health issues - United States, 2022. Morbidity and Mortality Weekly Report, 73.
Butterworth, P., Leach, L. S., Strazdins, L., Olesen, S. C., Rodgers, B., & Broom, D. H. (2011). The psychosocial quality of work determines whether employment has benefits for mental health: Results from a longitudinal national household panel survey. Occupational and Environmental Medicine, 68(11), 806-812.
Butterworth, P., Strazdins, L., Rodgers, B., & Leach, L. (2010). Deriving an evidence-based measure of job quality from the HILDA survey. Australian Social Policy, 9, 67-86.
Cronin, T. J., Pepping, C. A., Halford, W. K., & Lyons, A. (2021). Mental health help-seeking and barriers to service access among lesbian, gay, and bisexual Australians. Australian Psychologist, 56(1), 46-60.
Cutler, D. M. (2022). The costs of long COVID. JAMA Health Forum, 3(5), e221809.
Emmer, C., Dorn, J., & Mata, J. (2024). The immediate effect of discrimination on mental health: A meta-analytic review of the causal evidence. Psychological Bulletin, 150(3), 215-252. doi: 10.1037/bul0000419
Fachelli, S., Suter, C., & Son, J. (2025). Measuring socioeconomic inequalities in a comparative perspective. Social Indicators Research, 1-11.
Flavel, J., McKee, M., Freeman, T., Musolino, C., van Eyk, H., Tesfay, F. H. et al. (2022). The need for improved Australian data on social determinants of health inequities. Medical Journal of Australia, 216(8).
Fourie, C. (2019). Gender, status, and the steepness of the social gradients in health. IJFAB: International Journal of Feminist Approaches to Bioethics, 12(1), 137-156.
Galobardes, B., Shaw, M., Lawlor, D. A., Lynch, J. W., & Smith, G. D. (2006). Indicators of socioeconomic position (part 1). Journal of Epidemiology & Community Health, 60(1), 7-12.
Gómez, C. A., Kleinman, D. V., Pronk, N., Gordon, G. L. W., Ochiai, E., Blakey, C., Johnson, A. et al. (2021). Addressing health equity and social determinants of health through healthy people 2030. Journal of Public Health Management and Practice, 27(Supp. 6), S249-S257.
Guan, N., Guariglia, A., Moore, P., Xu, F., & Al-Janabi, H. (2022). Financial stress and depression in adults: A systematic review. PLoS One, 17(2), e0264041.
Harandi, T. F., Taghinasab, M. M., & Nayeri, T. D. (2017). The correlation of social support with mental health: A meta-analysis. Electronic Physician, 9(9), 5212.
Hassan, I., Chisty, A., & Bui, T. (2024). Structural and social determinants of health. In Leading an academic medical practice (pp. 343-355). Springer.
Hayanga, B., Stafford, M., & Bécares, L. (2023). Ethnic inequalities in multiple long-term health conditions in the United Kingdom: A systematic review and narrative synthesis. BMC Public Health, 23(1), 178.
Hayes, C., & Watson, N. (2009). HILDA imputation methods (HILDA project technical paper series No. 2/09). Melbourne Institute of Applied Economics and Social Researcher. melbourneinstitute.unimelb.edu.au/assets/documents/hilda-bibliography/hilda-technical-papers/htec209.pdf
Jackson, C. A., Dobson, A., Tooth, L., & Mishra, G. D. (2015). Body mass index and socioeconomic position are associated with 9-year trajectories of multimorbidity: A population-based study. Preventive Medicine, 81, 92-98.
Kendig, H., Loh, V., O'Loughlin, K., Byles, J., & Nazroo, J. Y. (2016). Pathways to well-being in later life: Socioeconomic and health determinants across the life course of Australian baby boomers. Journal of Population Ageing, 9, 49-67. doi.org/10.1007/s12062-015-9132-0
Kivimäki, M., Batty, G. D., Pentti, J., Shipley, M. J., Sipilä, P. N., Nyberg, S. T. et al. (2020). Association between socioeconomic status and the development of mental and physical health conditions in adulthood: a multi-cohort study. The Lancet Public Health, 5(3), e140-e149.
Krieger, N., Smith, K., Naishadham, D., Hartman, C., & Barbeau, E. M. (2005). Experiences of discrimination: validity and reliability of a self-report measure for population health research on racism and health. Social Science & Medicine, 61(7), 1576-1596.
Krnjacki, L., Priest, N., Aitken, Z., Emerson, E., Llewellyn, G., King, T. et al. (2018). Disability-based discrimination and health: Findings from an Australian-based population study. Australian and New Zealand Journal of Public Health, 42(2), 172-174.
Letelier, A., Jivraj, S., Heilmann, A., Watt, R. G., & Tsakos, G. (2022). Life course socioeconomic position and general and oral health in later life: Assessing the role of social causation and health selection pathways. SSM - Population Health, 17, 101026.
Liamputtong, P., & Rice, Z. S. (2021). Stigma, discrimination, and social exclusion. In Handbook of social inclusion: Research and practices in health and social sciences (pp. 1-17). Springer.
Mental Health in Multicultural Australia. (2014). Framework for mental health multicultural in Australia: Towards culturally inclusive service delivery. www.mentalhealthcommission.gov.au/sites/default/files/2024-03/framework-for-mental-health-in-multicultural-australia---towards-culturally-inclusive-service-delivery.pdf
Meurillon, R., Stheneur, C., & Le Roux, E. (2025). Discrimination against adolescents with chronic diseases: a systematic review. European Journal of Pediatrics, 184(1), 1-10.
Michaels, E., Thomas, M., Reeves, A., Price, M., Hasson, R., Chae, D., & Allen, A. (2019). Coding the Everyday Discrimination Scale: implications for exposure assessment and associations with hypertension and depression among a cross section of mid-life African American women. J Epidemiol Community Health, 73(6), 577-584.
Mossadeghi, B., Caixeta, R., Ondarsuhu, D., Luciani, S., Hambleton, I. R., & Hennis, A. J. (2023). Multimorbidity and social determinants of health in the US prior to the COVID-19 pandemic and implications for health outcomes: A cross-sectional analysis based on NHANES 2017-2018. BMC Public Health, 23(1), 887.
National Indigenous Australians Agency. (2025). Aboriginal and Torres Strait Islander Health Performance Framework: Summary report. National Indigenous Australians Agency. indigenoushpf.gov.au/report-overview/overview/summary-report
National Rural Health Alliance. (2024). Social determinants of health in rural Australia. National Rural Health Alliance. ruralhealth.org.au/wp-content/uploads/2024/11/NRHA-Social-Determinants-of-Health-Factsheet.pdf
NHS digital. (2024). Health Survey for England, 2022, Part 2. digital.nhs.uk/data-and-information/publications/statistical/health-survey-for-england
O'Donnell, J. (2022). Mapping social cohesion. The Scanlon Foundation Research Institute. scanloninstitute.org.au/sites/default/files/2022-11/MSC%202022_Report.pdf
O'Donnell, J., Guan, Q., & Prentice, T. (2024). Mapping social cohesion. The Scanlon Foundation Research Institute.
Otten, D., Tibubos, A. N., Schomerus, G., Brähler, E., Binder, H., Kruse, J. et al. (2021). Similarities and differences of mental health in women and men: a systematic review of findings in three large German cohorts. Frontiers in Public Health, 9, 553071.
Priest, N., Truong, M., Chong, S., Paradies, Y., King, T. L., Kavanagh, A. et al. (2020). Experiences of racial discrimination and cardiometabolic risk among Australian children. Brain Behavior, and Immunity, 87, 660-665. doi.org/10.1016/j.bbi.2020.02.012
Puhl, R., & Brownell, K. D. (2013). Bias, discrimination and obesity. Health and Human Rights in a Changing World, 581-606.
Quinn, B. R., & Martin, S. (Eds.). (2022). Insights #2: Findings from Ten to Men - The Australian Longitudinal Study on Male Health, 2013-21. Melbourne: Australian Institute of Family Studies.
Shang, X., Peng, W., Wu, J., He, M., & Zhang, L. (2020). Leading determinants for multimorbidity in middle-aged Australian men and women: A nine-year follow-up cohort study. Preventive Medicine, 141, 106260.
Sherbourne, C., & Stewart, A. (2020). Description and scoring instructions: MOS Social Support Survey. cadc.ucsf.edu/sites/g/files/tkssra881/f/Description%20and%20Scoring%20Instructions%20MOS%20Social%20Support%20Survey.pdf
Sherbourne, C. D., & Stewart, A. L. (1991). The MOS social support survey. Social Science & Medicine, 32(6), 705-714.
Swami, N., Prattley, J., Bandara, D., Howell, L., Silbert, M., Renda, J. et al. (2022). Ten to Men: The Australian Longitudinal Study on Male Health. Waves 1-3. Australian Economic Review, 55(1), 155-165.
doi.org/10.1111/1467-8462.12453
The Lancet Public Health. (2023). Health and inequity in Australia. The Lancet Public Health, 8, e575.
Timonin, S., Adair, T., Welsh, J., & Canudas-Romo, V. (2025). Socioeconomic inequalities in life expectancy in Australia, 2013-22: An ecological study of trends and contributions of causes of death. The Lancet Public Health, 10(7), e599-e608.
Turner, R. J., & Brown, R. L. (2010). Social support and mental health. A handbook for the study of mental health: Social contexts, theories, and systems, 2, 200-212.
Volpe, F., Biddiscombe, K., Silbert, M., & Martin, S. (2024). Ten to Men: The Australian Longitudinal Study on Male Health - Data User Guide, Version 6.0, December 2024. Australian Institute of Family Studies.
Wang, M. L., Narcisse, M.-R., Togher, K., & McElfish, P. A. (2024). Job flexibility, job security, and mental health among US working adults. JAMA Network Open, 7(3), e243439-e243439.
Wang, S., Kamerāde, D., Burchell, B., Coutts, A., & Balderson, S. U. (2021). What matters more for employees' mental health: Job quality or job quantity? Cambridge Journal of Economics, 46(2), 251-274. doi.org/10.1093/cje/beab054
Warren, J. R. (2009). Socioeconomic status and health across the life course: A test of the social causation and health selection hypotheses. Social Forces, 87(4), 2125-2153.
World Health Organization (WHO). (2025). World report on social determinants of health equity. Geneva: WHO. who.int/teams/social-determinants-of-health/equity-and-health/world-report-on-social-determinants-of-health-equity#:~:text=Launched%20on%206%20May%202025%2C%20the%20WHO%20World,than%20our%20genes%20and%20access%20to%20health%20care.
World Health Organization. (n.d.). Social determinants of health: Key concepts. WHO. who.int/news-room/questions-and-answers/item/social-determinants-of-health-key-concepts
Wilkins, R., Ferdi Botha, Laß, I., & Peyton, K. (2022). The household, income and labour dynamics in Australia survey: Selected findings from Waves 1 to 22. Melbourne Institute of Applied Economic and Social Research. melbourneinstitute.unimelb.edu.au/__data/assets/pdf_file/0003/5229912/2024-HILDA-Statistical-Report.pdf
Williams, D. R., Yan, Y., Jackson, J. S., & Anderson, N. B. (1997). Racial differences in physical and mental health: Socio-economic status, stress and discrimination. Journal of Health Psychology, 2(3), 335-351. doi.org/10.1177/135910539700200305
Williams, J. S., Cunich, M., & Byles, J. (2013). The impact of socioeconomic status on changes in the general and mental health of women over time: Evidence from a longitudinal study of Australian women. International Journal for Equity in Health, 12(1), 25.
Zhu, F., Boersma, E., Tilly, M., Ikram, M. K., Qi, H., & Kavousi, M. (2024). Trends in population attributable fraction of modifiable risk factors for cardiovascular diseases across three decades. European Journal of Preventive Cardiology, 31(14), 1724-1733. doi.org/10.1093/eurjpc/zwae219
1 While traditional SES indicators (e.g. education, employment, education and household income status) have been included in this report, they have been incorporated as covariates in examining the relationship between the selected key SES indicators and outcome measures (see 'Socio-demographic and behavioural factors', below).
2 Includes all mental health and long-term health conditions included in the Ten to Men survey. Main conditions refers to conditions without sub-categories, such as asthma. For conditions with sub-categories, such as cancer, diagnosis date was assigned to the sub-categories. Therefore, all 51 sub-categories have been included in the analysis.
3 One of the key predictors, area-level disadvantage - measured using SEIFA IRSD - was not significantly associated with any of the outcomes. See supplementary materials, Tables S11-S13, for full model results.
4 This estimate is based on the carryover imputation technique applied to impute missing data (details in the supplementary materials).
5 Due to small number of observations, we grouped occasionally/often/very often together.
6 Reasons included language or accent, skin colour, age, disability, religious beliefs, cultural background, mental health problems, sexual identity, body size/shape/physical appearance, sex, gender identity.
Acknowledgements
The authors of this chapter are grateful to the many individuals and organisations who contributed to its development and who continue to support and assist in all aspects of the Ten to Men study. The Department of Health, Disability and Ageing commissioned and continues to fund Ten to Men. The study's Scientific Advisory and Community Reference Groups provide indispensable guidance and expert input. The University of Melbourne coordinated Waves 1 and 2 of Ten to Men and Roy Morgan collected the data at both these time points. The Social Research Centre collected Wave 3 and Wave 4 data.
A multitude of AIFS staff members collectively work towards the goal of producing high-quality publications of Ten to Men findings. This publication greatly benefited from the guidance of the AIFS Executive (Liz Neville, Catherine Andersson) and Communications teams (Katharine Day, Rachel Evans). Particular thanks go to the survey methodology team (Karen Biddiscombe, Aeysha Corrigan and Anais Keenan) and data management and linkage team (Frank Volpe, Melissa Suares, Michelle Silbert) for their efforts in collecting and managing Ten to Men data. We would also like to thank Dr Monsurul Hoq for his input on the analysis approach.
We would especially like to thank every Ten to Men participant and their families who give so generously with their time and energy in completing our study surveys.
About the authors
Mulu Woldegiorgis, Katrina Scurrah, Karlee O'Donnell, Constantine Gasser, Catherine Andersson and Sean Martin are from the Australian Institute of Family Studies.
Featured image: Cover image: © GettyImages/Pixdeluxe
Suggested citation
Woldegiorgis, M., Scurrah, K., Gasser, C., Andersson, C., & Martin, S. (2025). The two-way relationship between socio-economic status and health conditions for Australian men. Insights #3, Chapter 3. Melbourne: Australian Institute of Family Studies.
28 October 2025